Bear Flag Pattern
BL
Summary:
A bear flag pattern is a continuation trading pattern that forms during a downtrend and is typically part of an extended bear run. The flag indicates a bearish bias and that the asset price will break further to the downside. The pattern emerges after a vertical drop in the asset price, which forms the pole, followed by a period of consolidation that forms the flag.
To most people investing in stocks, options, bonds, cryptocurrency, and other assets, an extended market downturn can be a stressful event. It is disappointing if they were going long on the asset, expecting it to appreciate in value over time. For those traders who short the market, however, an extended market downturn is exactly what they would like to see. Perhaps they had an opening bet, and as the market continues to decline, they want to deploy more capital in a short position to take advantage of the price’s continued descent. In this case, many traders will look for a bear flag pattern to determine a good place to get into the market while expecting further price declines ahead.
What is a candlestick pattern?
A candlestick pattern is a graphic representation of changes in price on a candlestick chart that some traders believe can predict future price movements. Bullish patterns predict increases in price, while bearish patterns indicate that the price may drop. Check out our in-depth article about how to read these charts and some other common patterns.
What’s a bear flag pattern?
A bear flag pattern is a continuation chart pattern that appears during a bear run or downtrend in the market. This stands in stark contrast to the bull flag pattern, which appears during a bull run and an uptrend in the market. It indicates that the market will indeed continue its descent, and the price will continue to drop lower. The vertical drop in the asset price representing the pole is followed by a period of consolidation, which resembles a flag. It’s important to point out that a bear flag pattern flag does not need to be a perfect square. The lines of support and/or resistance might angle or slope slightly. Many times bear flag patterns will have support and resistance slopes that angle upward.
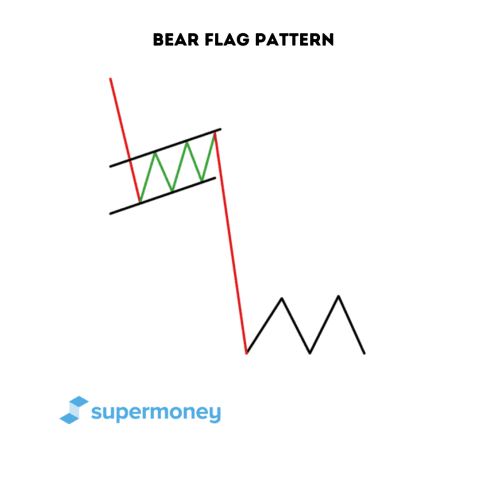
Another feature of a bear flag, and flags in general, is that the support and resistance trend lines run parallel to each other and don’t converge. The bear flag chart pattern represents a period of rest by the sellers before they make another strong push to the downside. The pole forms when the asset price spikes and moves significantly lower, which indicates a strong push downward by the sellers.
The horizontal nature of the flag shape, even if angled slightly up or down, means that there is no appreciable drop or increase after the initial rally. The price moves up and down, hitting both resistance and support. During this consolidation period, traders are locking in their gains, causing the price to trend up, whereas new sellers are jumping to cause the price to trend down. It’s important that one combines patterns with various other forms of technical analysis before making a play in the market.
Many of the best traders in the world still have difficulty spotting patterns. In fact, nobody can know for sure how a trend will develop and what pattern it will form until after the fact. If you are a novice investor, it’s smart to get the advice of experts who understand the market and use brokerages that grant access to the most advanced tools.
What constitutes a bear flag pattern?
To spot a proper bear flag formation as a chart pattern, the following elements need to exist.
Consolidation
Once the pole forms, the flag pattern goes through a period of consolidation. During this period, the price does not move significantly down one way or another, and volume declines from the downward drop that was apparent during the formation of the pole.
Pole
During an extended bear run, there could be a downward spike that symbolizes a large drop in the asset price. This spike downward forms the pole of the bear flag. The spike can be a single candlestick or it can be several.
Parallel support and resistance lines
In a bear flag pattern, the support and resistance levels run slightly parallel to each other. This doesn’t mean that the support and resistance lines won’t slope at all. In many cases, one or the other might slope slightly, and in the case of a bear flag pattern, they both might slope down. However, the patterns are not on the path to convergence as you see with triangles, wedges, and pennants.
Break to the downside
As a flag is seen as a “resting” pattern before the resumption of a bear run, the pattern will most certainly break to the downside. More often than not, this will happen at the end of the flag pattern; it can, however, break down and escape the pattern every time.
Volume
The volume will typically be very high when the flag pole is created. It will then level off during the consolidation period as the market regroups. Once the flag pattern price breaks, there will be an increase in the volume, of course, similar to other patterns.
Real-life example: Dow Jones Industrial Average
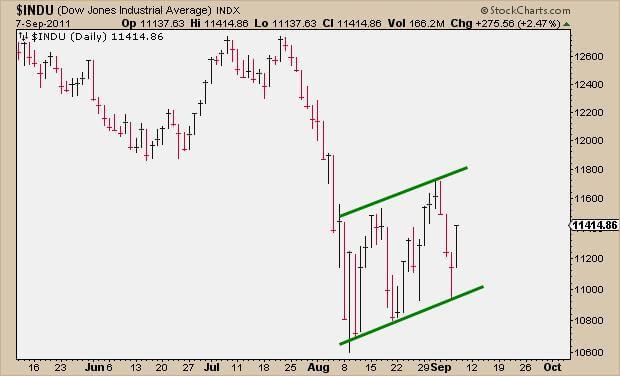
The above graph shows a bear flag continuation pattern that manifests during an extended bear run. In this case, we are looking at the Dow Jones Industrial Average in September 2011. In August of 2011, the Dow Jones made an extended bear run until it hit its bottom. Then the bear flag appears. This would have offered a great point for investors to jump in before executing the trading thesis that the price will continue to drop. You can see the flag pole form by a sharp drop in the asset price.
Bear flag patterns can be a great way to get into a bear run for those who love to short. But how can you be sure you spot a bear flag on a big short you want to deploy? Nobody can for sure, but the only way to get better is to practice, preferably with small amounts at the beginning. Here are some brokerages that can get you started today.
Why does the pole form?
The pole is caused by a significant drop in the asset price. As the market was trending down beforehand, this spike often forms with more bad news about the asset. For instance, if a company owes money to creditors and officially defaults on this debt, this can cause an immediate drop in price. The drop represents a moment when sellers have piled on.
Why does the flag form?
The forming of the flag can best be described as a sort of “rest” in the market. The flagpole was a large downside spike, and now the price is hitting similar resistance and support levels. This happens for two reasons. New sellers are jumping in to take advantage of the bear run and short their positions. And those shorters who are already in are closing their positions and taking profit. As traders take profit, it sends a buy signal and pushes the trend upward. However, the eager new shorters are not going to let it get pushed up too much and jump right back in to push the price back down.
Pro Tip
A common mistake for novice traders is that they will misidentify a bear flag as a different pattern. They might think it indicates a reversal to a bullish break rather than a continuation of a downtrend. Bear flags, when they trend upward, turning the consolidation period, will not have as sharp moves to the upside as a pattern that indicates a reversal to a bull run.
Bear flag trading philosophy
Let’s review how traders would respond to a bear flag pattern.
When to open a trade
Different traders and brokerage professionals will have different theories about when to open a long position when they spot a bear flag in an extended downtrend. A more aggressive trader might open the trade near one of the peaks and close to the resistance level. This would indicate that the trader is certain there will be a break to the downside. So they are willing to try to obtain a slightly better price by buying near the resistance level during the consolidation phase.
A more conservative trader might want to wait until the pattern breaks. They will open the trade around the point where the pattern breaks the shape. They might even wait for a confirmation hit as well to prove this is indeed a continuation of a bear run.
How to manage the downside
For people looking to short an asset, the downside must be managed in case the asset price goes up significantly, and the market reverses. Depending on the general trading strategies of the trader, as well as their trading thesis on the asset, they could put the buy stops in different places. A more conservative trader might put a buy stop near the resistance line to get them out of the trade as soon as there are significant upward trends. A more aggressive trader might put their buy stop well above the resistance line to ensure that a larger upswing in the market can be accounted for before the asset price continues its descent.
FAQ
What is a bear flag pattern?
A bear flag pattern is a continuation pattern that forms during a downtrend and is typically part of an extended bear run. The pattern is made up of a steep drop in an asset price that forms the pole, followed by a period of consolidation that forms the flag.
Is the bear flag bullish?
No, a bear blag is typically bearish, hence the name. The opposite of a bear flag is a bull flag pattern.
What happens after a bearish flag pattern?
The formation of the flag depicts a period of “rest” in the market. Afterward, the asset price should make a break to the downside. Bull flag patterns and bear flag patterns symbolize a period of consolidation in the market before they resume their previous trends.
How accurate is a bear flag?
A bear flag can be quite accurate, but it must be properly identified. Furthermore, a trader should also incorporate various other forms of technical analysis before opening a trade on an asset in any direction.
When should I buy a bearish flag?
A more aggressive trader who is sure that the market will continue going down might get into the market before the breakdown point and near the resistance trend line. A more conservative trader might only open a short at the breakout point and possibly with further pullback and confirmation.
Key takeaways
- A bear flag pattern manifests itself during an extended bear run and represents a period of consolidation before the asset price continues its descent downward.
- The flag in the bear pole forms with a significant drop in the asset price. After the drop, there is a consolidation period where the lower trend line and upper trend line run parallel to each other, forming the flag.
- The flag forms when sellers are realizing gains, which will cause the asset price to trend upward while new open short positions are being established, making the asset price trend downward.
- There are different options for opening a position and managing the downside, depending on the trader’s overall philosophy and trading strategy.
Share this post: