Bull Flag Pattern
BL
Summary:
A bull flag pattern is a continuation trading pattern that forms during an uptrend and is typically part of an extended bull run. The flag indicates a bullish bias and that the asset price will break out further to the upside. The pattern emerges after a vertical rise in the asset price, which forms the pole, followed by a period of consolidation that forms the flag.
Strong bull runs can be a wonder to behold. The general energy in the market is palpable, and buyers are lining up to get some of the action before they lose the opportunity to get in for what they would consider good value. With strong bull runs, there will typically be a further catalyst, such as news that a pharmaceutical company just produced the cure for cancer. An announcement of a government contract for a certain company can also result in a strong bull run. Sometimes, even in strong bull runs, when the market seems to ascend constantly, there can be good points to get in. Some of these points appear on defined and verified patterns, and in the case of a bull run, bull flag chart patterns are some of the most popular.
What’s a bull flag pattern?
A bull flag pattern is a continuation pattern that appears during a bull run or uptrend in the market. This stands in contrast to a bear flag, or bearish flag, which will manifest during a bear market. A bullish flag pattern indicates that the market will indeed continue its ascension, and the price will go higher. A bull flag pattern typically occurs after a large upward spike that forms the “pole” of the flag. The vertical jump in the asset price representing the pole is followed by a period of consolidation, which resembles a flag. It’s important to point out that a bull flag pattern’s flag does not need to be perfectly square. The lines of support and/or resistance might slope slightly; in many cases, they slope down slightly.
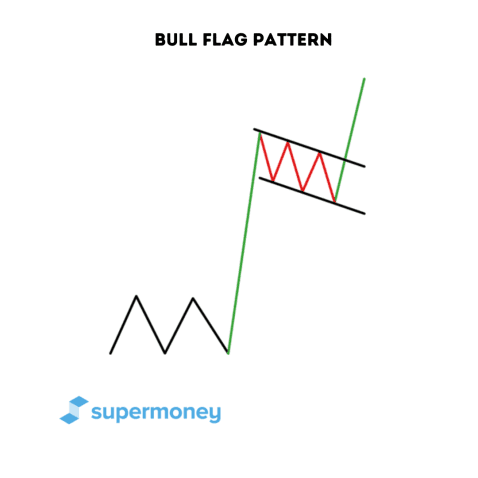
However, this is not to be confused with a pennant, which has a similar pole. On a pennant, the flag resembles a symmetrical triangle converging on a point rather than a boxy flag shape. The bull flag pattern represents a period of rest by the buyers before they make another strong push to the upside and continue the preceding trend. The support level and resistance level then run parallel to each other. The pole forms when the asset price spikes and moves significantly higher, which indicates a strong push by the buyers. The horizontal nature of the flag shape, even if slightly angled down, means that there is no appreciable drop after the initial rally, and the price moves up and down, hitting both resistance and support. During this consolidation period, traders are locking in their gains, causing the price to trend down, whereas new buyers are jumping to cause the price to trend up.
What constitutes a bull flag pattern?
Both a bullish flag pattern and a bearish flag pattern will have very similar characteristics but with different indications about which way the trend will continue. Here are some components that make up a bull flag chart pattern.
Consolidation
Once the pole is formed, the flag pattern goes through a period of consolidation. During this period, the price does not move significantly down one way or another, and volume declines from the spike that was apparent during the formation of the pole.
Pole
During a bull rally, you might have consecutive swings up. There might be a huge push upward, represented by a single or a few long candlesticks. This push constitutes the flagpole in the pattern. A flagpole is always made up of a strong push to the upside, and once the pattern forms, it looks like the pole of a flag in a bullish flag formation.
Parallel support and resistance lines
In a bull flag pattern, the support and resistance trend lines run slightly parallel to each other. This doesn’t mean that the support and resistance lines won’t slope at all. In many cases, one or the other might slope slightly, and in the case of a bull flag pattern, they both might slope down. However, the patterns do not start to converge like you see with triangles, wedges, and pennants.
Break to the upside
As a flag is seen as a “resting” pattern before the resumption of a bull run, the pattern will most certainly break to the upside. Typically this happens toward the end of the flag after some further consolidation has occurred. However, as the market was a bull before, it can break out of the resistance trend line at any point.
Volume
The volume will typically be very high when the flag pole is created. It will then level off during the consolidation period, as the market regroups. Once the flag pattern breaks, there will be an increase in the volume, of course, similar to other patterns. Bull flags are seen as a resting period in the market, and thus the volume goes up with the pole, rests, and then increases when it hits the breakout point.
Real-life example: Swiss franc
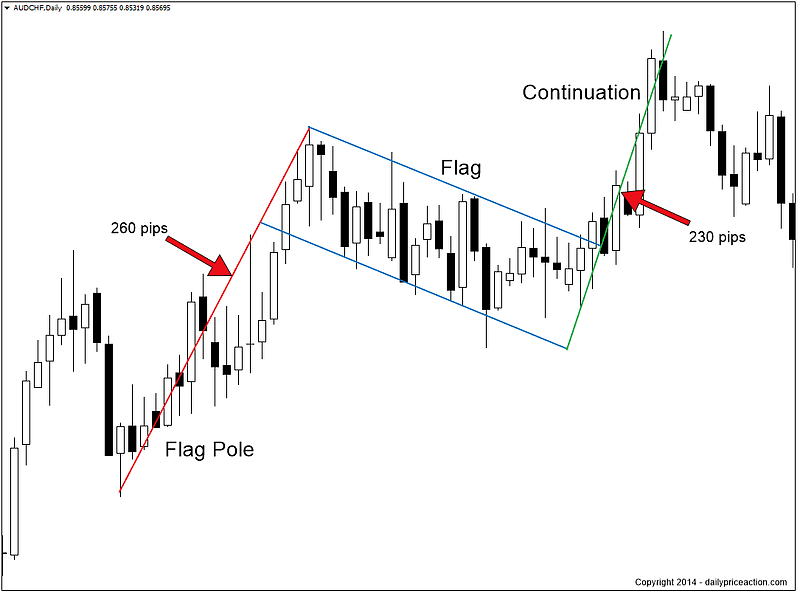
Here we can see a bull flag in price action revolving around the USD and CHF (Swiss franc). You can see a large uptrend that creates the pole of the flag. The uptrend continues until it hits a peak. Afterward, you have a continuation pattern that slopes down slightly, but the resistance and support levels hit at parallel points. Once the asset price breaks out, you see a big movement to the upside, and the price continues its ascension.
Trading a bull flag pattern can be profitable as long as you know exactly what to look for. The best way to start trading patterns is to dip your toe in and practice. Here are some brokerages that can get you started.
Why does the pole form?
The pole is usually a significant spike up. What causes this spike? That’s due to a myriad of reasons that could have made the asset price shoot up. It could have been good news that just happened as it relates to the underlying asset. For instance, if the underlying asset is stock in a company that builds roofing for schools, and they just signed and announced a federal government contract, this could cause the price to spike considerably.
Pro Tip
The pole can be formed by one huge candlestick spike up. Other times, multiple upward spikes make up the pole; it’s important to let the pattern form before you make any significant moves. A trader might think they see a pole forming, but then they don’t let the consolidation properly form the flag.
Why does the flag form?
The forming of the flag can best be described as a sort of “rest” in the market. The flagpole was a huge upside break, and now the price is hitting similar resistance and support levels. This happens for two reasons: new buyers are jumping in to take advantage of the bull run, and those who are already in are taking a profit. As traders take profit, it sends a sell signal and pushes the trend downward. However, the eager new buyers are not going to let it get pushed down too much, so they jump right back in to push the price back up.
Bull flag trading philosophy
Let’s review how traders would respond to a bull flag pattern.
When to open a trade
Traders will have different theories about when to open a long position and trade the bull flag pattern when it is spotted in an extended uptrend. A more aggressive trader might open the trade near one of the troughs and close the support level. When trading the bull flag pattern, this would indicate that the trader is certain there will be a break to the upside. So they are willing to try to obtain a slightly better price by buying near the support level during the consolidation phase. A more conservative trader might want to wait until the pattern breaks. They might even wait for a confirmation hit to prove this is indeed a continuation of a bull run.
How to manage the downside
No matter which brokerage you use, managing the downside is important. Firstly, it should be made clear that the bull flag is a very bullish pattern, and once it forms, there is a general assumption that the asset price will continue its ascent. Therefore, more aggressive traders would put a stop loss well below the support line. They do this just in case there is an unusual dip in the price before it resumes its uptrend. A more conservative trader would put the stop loss closer to the support line to make sure any sort of downside is covered as much as possible.
Sometimes, you need to manage the downside of possibly losing money while you do your own trading. The best way to manage that downside is to opt for a retirement plan that has more of a long-term focus. Here are some advisors ready to assist you.
FAQ
What is a bull flag pattern?
A bull flag pattern is a continuation chart pattern that forms during an uptrend and is typically part of an extended bull run. The pattern consists of a pole that is caused by a spike in price, followed by a period of consolidation in which the resistance and support levels stay the same. This causes the top and bottom levels to be parallel to each other. Once the price breaks out of the pattern, it should resume its bull run. The opposite of a bull flag pattern is a bear flag pattern.
How reliable is a bull flag pattern?
Flag patterns are some of the most reliable. That being said, they should only be used in conjunction with other forms of technical analysis to determine if the trade is really worth it.
How do you identify a bull flag?
You can identify a bull flag by first determining if the market is really in a bull run. You would then look for a pole, which is a spike in price. After the spike, there should be a consolidation period that moves up and down at parallel levels before breaking to the upside.
Where can I find a bullish flag pattern?
You can find a bullish flag pattern during an uptrend of a bull run in the market. The trick is locating a proper pole first. Then the activity after the pole during the consolidation phase should move up and down.
What is the most reliable stock pattern?
Many traders say the head and shoulders pattern is among the most reliable. However, patterns should be combined with other forms of technical analysis to be as reliable as possible. Traders will also have different goals in terms of their target prices and the reliability of the patterns reaching those prices.
Key takeaways
- A bull flag chart pattern is a continuation chart pattern that forms during an uptrend and is typically part of an extended bull run.
- The pattern consists of an upward spike in the asset price, which makes up the flag pole, followed by a period of consolidation with parallel support and resistance levels, which makes up the flag.
- A bull flag pattern can be viewed, alongside trading strategies, as a period to get into the market. It is seen as a period of “rest” until the market continues its ascent.
- A bull flag pattern is a representation of traders both locking in profits as well as opening up new positions. This is why the support and resistance lines run parallel on a bull flag.
Share this post: