Inverse Head and Shoulders Pattern
BL
Summary:
An inverse head and shoulders pattern (also known as a reverse head & shoulders pattern) is a trading pattern that consists of three troughs and two peaks. The peaks stay at roughly the same level of resistance that forms the neckline. The first and third troughs are at roughly the same level of support, with the second trough touching a lower low than the first and third. The pattern usually indicates a bullish bias and the reversal of a downtrend to an uptrend. It is the inverse of the traditional head and shoulders pattern.
Traders will use various forms of technical analysis to infer which way a market might move. Once they collect the data, they might decide to open a trade one way or another based on identifiable patterns. In another article, we explain how the head and shoulders pattern can emerge in an uptrend to signal a reversal toward a downtrend. The head and shoulders pattern can also form inversely. In that case, it will have three troughs as opposed to three peaks, and two peaks, as opposed to two troughs, that are more or less at the same resistance level. In the inverse head and shoulders pattern, momentum at the end of the pattern lies squarely with the buyers, and thus there should be a breakout to the upside.
What is a candlestick pattern?
A candlestick pattern is a graphic representation of changes in price on a candlestick chart that some traders believe can predict future price movements. Bullish patterns predict increases in price, while bearish patterns indicate that the price may drop. Check out our in-depth article about how to read these charts and some other common patterns.
What is an inverse head and shoulders pattern?
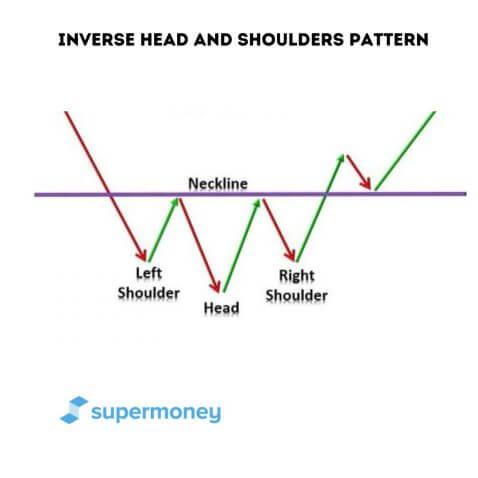 An inverse head and shoulders chart pattern consists of two peaks and three troughs. The resistance line stays relatively the same — the peaks are roughly equal at the top points before they begin to trend downward. The three troughs work as follows: the first trough (left shoulder) and third trough (right shoulder) are roughly the same heights, hitting similar points on the top resistance level. The second trough (the head) is lower than both the first and third troughs. The trend typically indicates a reversal pattern in which the market will now turn from bearish to bullish.
Think of this type of pattern like the head and shoulders of a person standing up. As you might know, in the upright pattern, this indicates a bearish reversal. With the inverse head and shoulders pattern, you also see the outline of a person’s head and shoulders, but this time the person is hanging upside down. Many times, an inverse head and shoulders pattern is a strong indicator that the market will reverse from a bearish trend into a bullish one. The momentum switches to the buyers, and they are ready to break out.
What makes up a head and shoulders pattern
Unlike the traditional head and shoulders pattern, an inverse head and shoulders pattern will most likely indicate a bullish bias. Buyers should move in, anticipating a significant break to the upside. Here is what makes up a head and shoulders pattern.
Consolidation
Consolidation occurs when the market is trading within a range. It’s generally attributed to market indecisiveness in which there are no clearly defined breakout trends yet. It’s the time frame when the price narrows and patterns can emerge.
Three troughs at different support levels
The pattern consists of three consecutive troughs that touch the support line at different points. The pattern will hit the first trough before being pushed back by the buyers. The buyers will then offer an even lower level of support on the second trough. On the third trough, the buyers offer a higher level of support, similar to the point of the first trough.
Two peaks
The pattern will consist of two high points or peaks at generally the same price point. These two peaks do not have to be at the exact same point, as the pattern can slope. However, it does indicate similar points where the sellers push back.
Pro Tip
In the traditional head and shoulders pattern, the pattern can slope, so we compared it to a person leaning one way or another. On the inverse pattern, think of a person hanging upside down and swaying one way or another. The pattern might take shape when the person sways rather than being at a standstill.
Multiple points hit
An inverse head and shoulders pattern, like a traditional head and shoulders pattern, should hit approximately five points. Three points in the trough and two points on the peak make it a viable pattern. However, some traders might advise waiting longer for possible additional consolidation to occur.
Break to the upside
The inverse head and shoulders pattern indicates that the market is going to reverse from a downtrend to an uptrend. Many times this will occur towards the bottom of a downtrend. Once it breaks through the top resistance level, it’s possible that this can represent a breakout of the pattern and a continual uptrend.
Real-life example: Price of cocoa
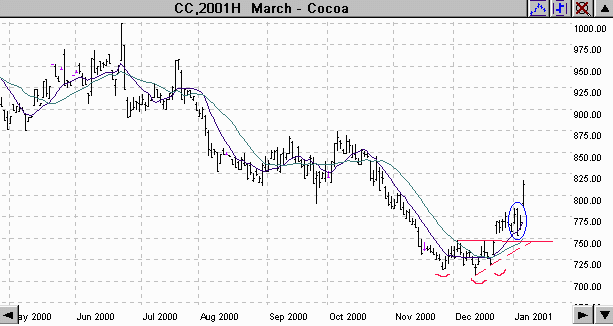
Here we can see a chart that tracks the price of cocoa over a period of a few months. As you can see, the inverse head and shoulders pattern begins to form at the end of the downtrend in the price. The volume would have decreased as the pattern consolidated. Once it hits its breakout point, the volume should increase significantly as the asset price breaks out of the pattern and ends in an upward trajectory.
If you are reading this, you might be interested in trading. There are many brokerages available, and some might even offer in-depth training programs. Check out some of your brokerage options.
Why are the troughs unequal?
Just like the traditional head and shoulders pattern, the inverse head and shoulders pattern indicates there might be a reversal, this time to the upside. The sellers are holding the resistance level. On the first trough (left shoulder), they make a push upward but are not able to get very far. On the second push, the sellers make more headway and are able to push the price down even further. In the last trough, however, the sellers are not able to push down as far as they did on the second trough. This represents a shift in momentum from the sellers to the buyers. Had the sellers continued with their momentum, they would have been able to push the price down to a similar level as the second trough, but they didn’t.
Why are the peaks roughly equal?
The peaks are generally equal at the top-line resistance trend level as the sellers are holding the resistance line at that point. They jump in at that top-line resistance level on the first two peaks as soon as the asset price hits that point. They are holding the resistance line but losing momentum as they try to make a push down to the second trough level but only end up at the point of the first trough. Although they have been successful in holding the resistance line, as the momentum is now with the buyers, they can hold the line no more. Here, you should get a breakout.
Volume and time frame
Head and shoulders patterns work similarly to other chart patterns in which volume will significantly decrease as the pattern takes shape. Once the price starts to break the pattern, the volume will increase; in this case, on behalf of the buyers pushing the price up. In terms of market dynamics, trend reversals have strong trends leading up to them. With this pattern, it would be a downtrend. One trick some traders use regarding time frame is to note that the downtrend heading into the pattern should be twice as long as the distance between the two shoulders. This increases the chances that any reversal trend will be significant enough to take action on and open a trade.
Inverse head and shoulders pattern trading philosophy
Let’s review how traders would respond to an inverse head and shoulders pattern.
How would you open a trade?
Most patterns indicate that a trader will want to open a long position close to or at the breakout point. More aggressive traders might open the trade before the asset price breaks out of the pattern, close to the second trough. More conservative traders might wait for a further pullback and retest and thus open the trade closer to the third trough rather than the lower second.
How would a trader manage the downside?
Although bullish traders might think the pattern is going to make a clean break to the upside, they still want to protect their downside position. In that case, they might decide to do a couple of different things with the stop loss. A more aggressive trader might put the stop loss at the lowest level of the second trough to give room for the pattern to move. A more conservative trader might put the stop loss closer to the point of the third trough to ensure they are stop losses right away. This is in case the pattern doesn’t work out as hoped and continues on a downtrend.
Are you looking at different investments but have no idea where to go for advice? Here are some of our most-reviewed advisors.
FAQ
Is a reverse head and shoulders pattern bullish?
Yes, when a reverse or inverse head and shoulders pattern occurs, it signals a bullish reversal from an uptrend to a downtrend.
What does an inverse head and shoulders pattern indicate?
A head and shoulders formation indicates a reversal trend. In the case of an inverse head and shoulders pattern, the trend reversal should go from bearish to bullish. The pattern indicates that there might be a significant breakout to the upside once the asset price emerges from the pattern.
How reliable is an inverse head and shoulders pattern?
Both sets of head and shoulders patterns are among the most reliable patterns. A reverse head and shoulders pattern is generally considered more reliable than a wedge, for example.
How do you trade inverse head and shoulders patterns?
Depending on the trader’s risk profile, they might decide to open the trade at or around the breakout level. However, they might choose to open the trade at different points. The stop loss will be put close to the second or third trough, depending on the risk profile. If they want to be aggressive, they might put the stop loss closer to the second trough. If they want to be more conservative, they might put the stop less next to the third, higher-low trough. In terms of profit target, it really depends on the trader’s overall strategy, which may be heavily influenced by their own technical analysis.
What happens after a reverse head and shoulders pattern completes?
At the completion of a reverse head and shoulders pattern, there should be a breakout to the upside. The buyers have the momentum, as the sellers are not able to continue their momentum from the second trough to the third trough.
Key takeaways
- A reverse head and shoulders pattern consists of three troughs and two peaks. The peaks stay at roughly the same level of resistance that forms the neckline. The first and third troughs are roughly at the same level of support, with the second trough touching a lower low.
- The reverse head and shoulders pattern typically indicates a reversal pattern from a downtrend to an uptrend.
- Once complete, the reverse head and shoulders pattern indicates that momentum is on the side of the buyers. As the third trough is not as high as the second trough (the head), the sellers have failed in their mission to push the price down to the same level as the first.
- As with most patterns, traders will recommend you open the trade around the breakout level. Both opening trades and managing downsides correlate to a trader’s own philosophy and risk profile.
Share this post: