Understanding Runs in Technical Analysis: Definition, Examples, and Strategies
Summary:
A run, in technical analysis, signifies a series of consecutive price movements in the same direction for a particular security, sector, or index. This article delves into the intricacies of runs, encompassing their definitions, examples, and implications in trading strategies.
What is a run in technical analysis?
A run, within the realm of technical analysis, refers to a sequence of consecutive price movements that occur in the same direction for a specific security, sector, or index. These movements can manifest as either a sustained uptrend or downtrend, characterized by repeated daily gains or losses. In essence, a run illustrates a period of momentum, where the market sentiment drives prices consistently in one direction over a given period.
Key characteristics of runs:
Consecutive movements: Runs consist of consecutive price increases or decreases without significant reversals in the opposite direction.
Bullish and bearish runs: Depending on the direction of price movements, runs are classified as either bullish (uptrend) or bearish (downtrend).
Duration: There’s no fixed timeframe that defines a run, but it typically spans several trading sessions or weeks, depending on the intensity of the trend.
Volume and momentum: The strength of a run is often gauged by the underlying trading volume accompanying the price movements.
Chart patterns: Runs are often identified in conjunction with chart patterns and technical indicators, providing traders with signals for potential entry or exit points.
Understanding runs in trading
Traders and analysts closely monitor runs as they provide valuable insights into market dynamics and sentiment. By recognizing and interpreting runs, traders aim to capitalize on emerging trends, anticipate potential reversals, or manage risk effectively.
Role of runs in chart analysis:
Runs play a significant role in chart analysis, where they serve as key components in identifying trends, support and resistance levels, and potential reversal patterns. Analysts utilize various technical tools and methodologies to analyze runs, including:
Candlestick patterns: Certain candlestick patterns, such as the Three White Soldiers (bullish) or Three Black Crows (bearish), signify the presence of a run and provide insights into market sentiment.
Technical indicators: Oscillators (e.g., RSI, Stochastic), moving averages, and trendlines are utilized to confirm the strength and sustainability of a run.
Volume analysis: Changes in trading volume during a run can validate or invalidate the prevailing trend, indicating potential shifts in market direction.
Example of a run
To illustrate the concept of a run, let’s consider an example involving the SPDR S&P 500 ETF (SPY), a widely traded exchange-traded fund that tracks the performance of the S&P 500 index.
Example: Bull run in SPY
Between mid-January and late-February of 2017, SPY experienced a notable bull run, characterized by consecutive daily gains. During this period, the ETF exhibited a series of upward price movements, reflecting bullish market sentiment.
The chart below depicts the price action during the bull run:
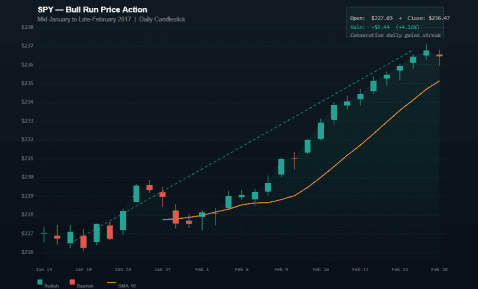
This bull run lasted for six consecutive trading sessions, with each day witnessing higher closing prices. The sustained upward momentum indicated a strong buying interest in the market, driving prices higher.
It’s essential to note that while runs like these present opportunities for traders, they also entail risks, including the potential for overextension and abrupt reversals.
The importance of recognizing runs
Recognizing and interpreting runs is crucial for traders and investors as they form the basis for many trading strategies and decisions. Understanding the dynamics of runs enables market participants to:
Identify trends: Runs help traders identify prevailing market trends, facilitating trend-following strategies.
Time entry and exit points: By recognizing the beginning and end of runs, traders can time their entry and exit points effectively, optimizing profitability.
Manage risk: Awareness of runs allows traders to implement risk management strategies, such as setting stop-loss orders and position sizing.
Formulate trading strategies: Various trading strategies, including trend following, breakout trading, and reversal strategies, rely on the identification and analysis of runs.
Frequently asked questions
What are the different types of runs?
Runs can be classified into two main types: bullish runs and bearish runs. Bullish runs involve consecutive upward price movements, indicating a sustained uptrend, while bearish runs consist of consecutive downward price movements, signaling a downtrend.
How do traders use runs in trading strategies?
Traders utilize runs in various trading strategies, such as trend following, breakout trading, and reversal strategies. By identifying and analyzing runs, traders can determine the prevailing market sentiment and adjust their trading approach accordingly.
What role do volume and momentum play in runs?
Volume and momentum are essential factors in assessing the strength and sustainability of runs. High trading volume accompanying price movements confirms the validity of a run, while momentum indicators, such as oscillators and moving averages, provide insights into the intensity of market sentiment.
Key takeaways
- Runs signify consecutive price movements in the same direction for a security, sector, or index.
- Bullish runs denote uptrends, while bearish runs indicate downtrends.
- Traders use runs to identify trends, time entry/exit points, and formulate trading strategies.
- Volume and momentum are crucial factors in assessing the strength of runs.
Table of Contents