Descending Triangle Pattern
BL
Summary:
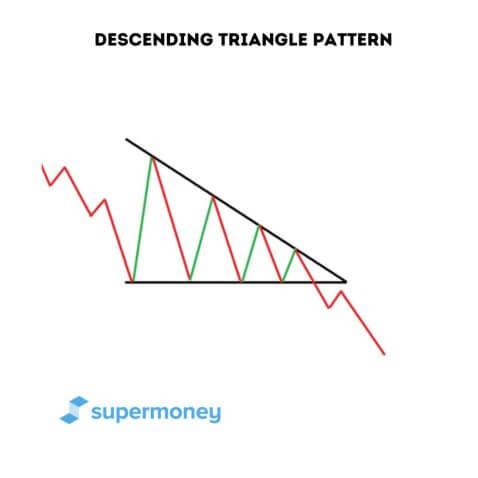
A descending triangle is a trading pattern in which there is a flat level of support at the bottom and progressively lower high points on the resistance level at the top. A descending triangle pattern usually infers a bearish outlook on the asset that results in an accumulation of sellers and short positions. The trading thesis is that once the price of the asset breaks through the pattern, there should be a long-term continuation trend downwards. A descending triangle usually indicates that sellers of the asset have a stronger hand than buyers.
Trading is a perpetual battle between buyers and sellers that affects the behavior and scope of the market. Sometimes, regardless of the intrinsic value or technical analysis of an asset, the behavior of people in the trading marketplace can significantly affect the value and movement of an asset in the short and medium terms. As buyers and sellers try to defend their positions on trades, certain patterns begin to emerge. Some of the most common patterns that might dictate the movement of an asset, particularly when implementing a bearish trading thesis, are descending triangle patterns. Learn more about them below.
Compare Brokerage Services
Compare multiple vetted providers. Discover your best option.
What is a candlestick pattern?
A candlestick pattern is a graphic representation of changes in price on a candlestick chart that some traders believe can predict future price movements. Bullish patterns predict increases in price, while bearish patterns indicate that the price may drop. Check out our in-depth article about how to read these charts and some other common patterns.
What is a descending triangle?
The descending triangle chart pattern is a continuation pattern that is defined by a flat horizontal lower trend line representing a level of support at the bottom of the trade and price tops (or resistance levels) that are becoming progressively lower. To put it simply, the bottom line is flat, and the top line is a descending slope, forming a triangle. Eventually, these two lines meet at a point, and this is when the asset might be able to break through the triangle shape and continue on a longer-term downward trend. The descending triangle chart pattern is generally considered a bearish chart pattern.
This pattern’s horizontal line of support and progressively lower tops emerge because of certain behaviors by other traders who are buying and selling. The accumulation of these behaviors creates the descending triangle pattern, which in turn gives an indication to the trader that the price of the asset might break out of the pattern and trend further downward. A descending triangle indicates that sellers of the asset are in an advantageous position.
What makes up a descending triangle pattern?
As opposed to an ascending triangle or symmetrical triangle, a descending triangle will typically have a bearish trading bias. However, on occasion, traders will use it in a bullish strategy. Below is an example of what this pattern looks like and the elements that cause it to be a viable pattern.
Consolidation
Consolidation occurs when the market is trading within a range but hasn’t broken out significantly in either direction. This is caused by traders being indecisive with their trades, whether buying or selling. However, in this consolidation time frame, small patterns can emerge that can indicate a significant break in one direction or another.
Progressively lower tops
The descending triangle pattern will have consecutively lower points at the top level of resistance that you can see through the descending upper trend line. This means the number of buyers that are coming in to defend the support line of the trade is getting progressively smaller. Within this pattern, sellers will have the upper hand as they continue to short the stock and the level of resistance at the top declines.
Horizontal support line
The descending triangle pattern is defined by a horizontal line of support at the bottom. When the price of the asset reaches this point, the buyers do not let it through. This is the floor of support that is being defended by the buyers. The sellers can’t quite break through yet, but if they do, there might be a significant continuation of a downward trajectory.
Multiple points
The pattern should meet its horizontal support level at least twice and reach its progressively higher bottom support levels at least twice to be considered a textbook descending triangle pattern. However, the more data one has on an asset’s behavior, the better. This means that hitting the bottom support line and progressively lower resistance levels multiple times (three to five) is recommended by the majority of traders.
Breakdown and continuation
The breakdown point is the point where the top and bottom lines of the triangle meet. Most traders are taught that this point is when they should implement a short trade. As the two points converge, this can represent the possibility of a significant breakdown and continued downward trend of an asset.
Real-life example: Swiss Franc in 1997
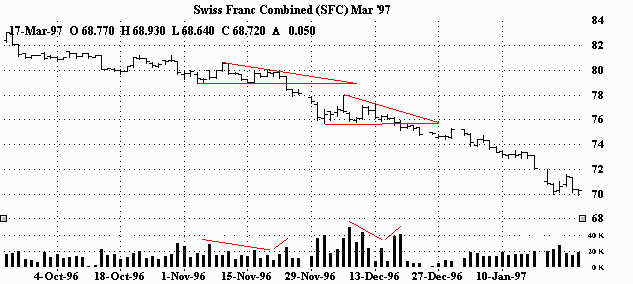
Here is an example of two descending triangles that are visible in the trading of the Swiss franc from October 1996 to January 1997. In the first descending triangle, the breakdown point happens towards the middle to the end of November 1996. You can see that the volume of the trade decreases right before the breakdown point, and then at the breakout point, it increases significantly, resulting in more downward momentum and a significant downward trend. Although the breakdown point in the second descending triangle doesn’t result in as big of a downward trajectory, there is still a significant volume that picks up once the breakdown point is reached.
Why does a descending triangle pattern occur?
As mentioned earlier, trading is often a battle between buyers and sellers. In the case of a descending triangle, the sellers have the power. The buyers are trying to hold the support level, but their position is getting more difficult to defend. Thus the upper trend line resistance becomes less and less. As the pattern continues, the buyers give less support, and the sellers become stronger. When the points converge, the sellers will increase their short positions through accumulation (increasing their positions) until the buyers cannot hold the support level anymore. Once they break through that last line of support defense, the sellers now have all the power, and the asset can take a significant turn downward.
Why is there a bottom horizontal line at the level of support?
As the triangle pattern indicates a downward trend, the sellers will have buy stops set toward the bottom of the pattern near the horizontal line. This will result in many buy stops being triggered and accumulated around the support line. However, due to market dynamics, the buyers that are holding the support position will become fewer and fewer. This is why the resistance level at the top continues to decrease. There are fewer buyers willing to hold their position as the battle of trading progresses.
Why are there progressively lower top points?
There are progressively lower top points in a descending triangle due to the progressively weaker hand of the buyers versus the sellers. As the sellers and stock shorters put downward pressure at the top, the level of support becomes lower and lower. The buyers defend their positions at lower and lower price points.
How does a breakdown happen?
A breakdown happens when the price breaks out of the triangle pattern and travels on a significant downward slope. As the sellers now have all of the power, they will attract other sellers and short positions, giving the downward trajectory momentum. As the buyer’s position to defend the support level dwindles, the momentum behind the sellers pushing the price down continues to grow. Once the buyers are unable to hold the support line, the momentum builds towards a breakout and long-term trajectory downward.
Descending triangle pattern trading philosophy
Let’s review how traders would respond to a descending triangle pattern.
When would traders open a short?
Most traders are told to open a short position at or close to the breakdown point, or where the points of the triangle converge. If traders open the short position before the breakdown point occurs, then the traders risk being stuck once again in the pattern. Furthermore, even if they do reach the exact breakdown point, there is the possibility that this could be a false breakdown. A false breakdown occurs when the descending triangle pattern does not result in a significant shift downward and instead swings back up into a continuation of the pattern. However, different traders have different philosophies, so where they open up the short can differ by both their individual preferences or information that they might be privy to.
Pro Tip
When buyers manage the downside of a long position, they set stop losses to protect them if the price rises. Short sellers will also set their own version of stop losses in case prices end up rising. This, however, is referred to as a stop buy, not a stop loss.
How traders manage the downside (price increase)
A trader looking to open up a short position wants to limit the risk of the price rising as much as possible while capitalizing on a substantial downward trajectory by buying near the breakdown point. Most traders will recommend setting a buy stop on their short position near the previous high that was defended by the buyers. However, once again, this depends on the trader’s risk profile and trading strategy.
Can a descending triangle be bullish?
Typically, traders will view a descending triangle with a bearish trading bias in a downtrend market. However, descending triangles can also be utilized in the context of a bullish strategy. If, for instance, the price reaches above the descending line, then this could indicate that the asset is taking a turn upward, and buyers will open up positions to buy.
Time frame of a descending triangle pattern
A descending triangle pattern is most commonly used with traders who are trading short- to medium-term. The pattern can range from weeks to months.
Volume in a descending triangle pattern
In a descending triangle pattern, the volume or trade activity tends to be lower closer to the breakdown point and then much higher as the points converge. Traders using a descending triangle trading strategy want to avoid the risk of a false breakdown. Once the sellers have momentum at the breakdown point, the volume will increase substantially, adding to the momentum and the significant downward trajectory of the price of the asset.
With all the diverse trading patterns that can potentially come up, the best course of action is to talk to a brokerage. They are the true trading sherpas that can point you in the right direction.
FAQ
How do you know if a descending triangle is bullish?
If the price breaks out of the descending trend line at the top, this could indicate that the asset might be taking a bullish turn. You might see it start to create a rising trend line at the top.
How do you trade a descending triangle pattern?
Most traders would suggest you open a short position or sell position when the trend lines converge at the breakdown point.
How do you use the ascending triangle pattern?
An ascending triangle pattern is typically used in a bullish trading thesis, but not always. Usually, with an ascending triangle pattern, a trader would buy at the breakout point when the trend lines converge. In the context of a seller or short position, traders would take a short position if the price fell out of the bottom ascending trend line.
Is a descending triangle bearish or bullish?
A descending triangle is usually bearish. However, on occasion, it can be used in bullish trades. A trader might buy if the price rises above the descending upper trend line.
How accurate is a descending triangle?
The pattern is potentially viable, but be careful. Many times you can have false breakdowns and the pattern might return to its original state. It’s important to remember that these patterns are not guarantees.
Is an ascending triangle always bullish?
No, an ascending triangle is usually bullish, but sometimes it can be used in a bearish trading strategy. In the context of a seller or short position, traders would take a short position if the price fell out of the bottom ascending trend line.
Key takeaways
- A descending triangle is a trading pattern in which there is a flat level of support at the bottom and progressively lower high points on the top resistance level.
- A descending triangle is most commonly used with a bearish trading thesis.
- Once the bottom support line and descending trend line of resistance converge, this represents a possible breakdown point. The price can break down into a significant downward trajectory.
- As the descending triangle reaches its breaking point, the volume will sometimes decline. However, it will increase significantly at the breakdown point.
Share this post: