Double Top and Double Bottom Patterns
BL
Summary:
Double top and double bottom patterns are two trading patterns that indicate a change in the market. In the case of a double top, it can be compared to an M-shape and usually insinuates that the pattern will result in a bearish reversal trend. In the case of a double bottom, it can be compared to the letter W and usually indicates a reversal from a downtrend into a bullish reversal trend.
When looking at price action, both live and historical, traders want to be aware of how long a pattern takes to form and what might have preceded it. If the market was trending in a general direction before the pattern occurred, either an uptrend or downtrend, then a trader must look at how much time it took for the trend to reach the point when it broke out of the pattern. For example, say the market was trending in an upward direction for months, and a reversal pattern emerged whose consolidation took only a matter of days. Then a trader has to think to themselves, “Will the uptrend continue after this pattern? Or is this pattern really indicative of a reversal to a downtrend?”
No matter what brokerage you use, this is especially true with some of the more difficult patterns to sport and verify — the double top and double bottom patterns.
Get Competing Personal Loan Offers In Minutes
Compare rates from multiple vetted lenders. Discover your lowest eligible rate.
It's quick, free and won’t hurt your credit score
What is a candlestick pattern?
A candlestick pattern is a graphic representation of changes in price on a candlestick chart that some traders believe can predict future price movements. Bullish patterns predict increases in price, while bearish patterns indicate that the price may drop. Check out our in-depth article about how to read these charts and some other common patterns.
What is the double-top pattern?
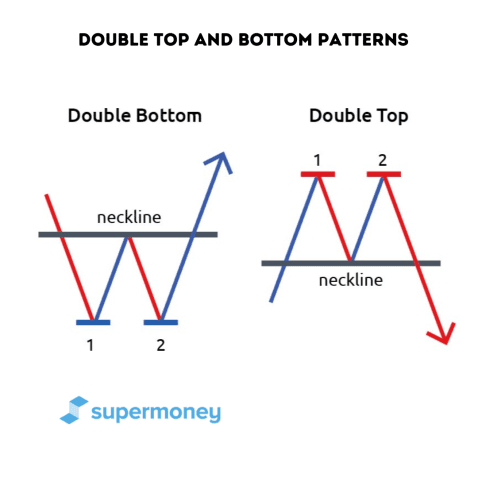 The double top and double bottom patterns are inverse versions of each other and will typically form over a longer period of time. With a double top, you have two peaks that form after an uptrend. The market was up-trending before, and now this could indicate that the asset price has peaked, and you might be in store for a break to the downside. In most cases, the first peak will be reached after an uptrend, followed by a slight downward trend, followed by a trend up to a second peak.
It’s important to note that the two peaks that form the tops of the M do not have to hit the same resistance level. In fact, the M can look kind of sloppy at times, which is why this pattern can be hard to discover. The second peak is often lower or higher than the first peak.
What is a double bottom pattern?
Just like the double top pattern forms an M, the double bottom pattern looks more like a W. With a double bottom, two troughs form after a downtrend and it is considered a bullish reversal pattern. The downtrend will hit a trough, then be pushed slightly back up, only to descend to a second trough. The market was trending down before, so this consolidation pattern could indicate there will be a breakout to the upside with a trend reversal. Again, the W might look messy and the second trough might be slightly higher or lower than its preceding trough.
The first step to start trading is to actually sign up to trade. Why just read about double tops and double bottoms when you could be double-using them to make money? Here are some brokerages that our reviewers recommend.
What constitutes a double top or double bottom pattern?
The following features appear in a double top or double bottom pattern. Remember, these patterns should be considered along with various other forms of technical analysis that indicate when and how to place a trade.
Consolidation
Consolidation happens when the market is trading within a range and the price narrows. The trick with double tops and double bottoms is that, usually, the pattern takes longer to form. There is more distance between the two peaks and two troughs than with other patterns.
Two rounding tops (double top)
In order to be a double-top pattern, two peaks have to form. Again, these do not need to be perfectly equal peaks (on the double top) or equal troughs (at the double bottom). The middle point of either the M or the W is important. In the case of a double top, the low in the middle should not be really close to the first peak, as this would indicate that nothing much is happening. It also shouldn’t be as low as the support line, as that would indicate it might be a different pattern.
Two rounding bottoms (double bottom)
For a lower bottom chart pattern, the middle point shouldn’t be close to the first trough, as that would indicate that nothing much was happening. Likewise, if it is as high as the resistance line, this might indicate that it is a completely different pattern. It’s important to note here that the peaks will probably be rounded peaks rather than one huge candlestick spike causing a peak. The troughs will also be rounded troughs.
Pro Tip
The rounded tops and troughs indicate that the price action isn’t just a one-off stab toward the top or the bottom. A well-rounded trader might like to see well-rounded tops and bottoms before they identify the pattern as viable.
Break in a reversal
A double top and double bottom are typically seen in the reversal of a long uptrend or downtrend. In the case of a double top, an uptrend would have led up to it, and now the M shape takes place during the long consolidation period. The sellers have momentum at the end of the pattern, and the trading thesis would be a bearish breakdown where the asset price breaks to the downside.
With a double bottom, a downtrend would precede it, and now the W shape takes place. The buyers have momentum at the end of the pattern, and the trading thesis would be a bullish break to the upside. The breakout should complete once the pattern reaches its completion at the neckline.
Time frame and volume
One of the most important elements to understand about double-top and double-bottom trends is that they are fairly long consolidation trends. There should be legitimate space in between the two peaks or two troughs indicating duration. The volume should also lessen during the pattern time frame until there is a break in the pattern in either direction.
Why does the M in a double top form?
The M forms after a long bull trend and indicates a switch in momentum. First, when you look at the battle between buyers and sellers, you need to consider the course of the war that preceded it. Until the point of this pattern, momentum was squarely on the buyer’s side as they were pushing the price up. When the M forms its first peak, the sellers come in, as this is the time they feel is a value play to start shorting it. There is pushback from the buyers as all the momentum preceding the pattern was bullish, so there are still many buyers in the market defending their positions. The bulls are able to enact buying pressure to push the price back up once more toward the resistance line. At this point, there should be momentum on the seller’s side, and they will make a push down to the bottom.
Why does the W in a double bottom form?
The W forms after an extended bearish trend and indicates a switch in momentum. Again, look at the course that preceded it. The sellers were controlling everything and had momentum on their side as the market was in an extended bearish trend. As the first trough of the W forms, that is the price that the buyers determine is a good value. They push the price up, but not as high as the preceding peak. They are met with resistance by the sellers as they are still leveling out the momentum that was built during the extended downtrend. The sellers are able to push down to a second trough, but the asset price is now being consolidated, with the buyers having the momentum. A breakout to the upside might occur.
If you are seeking independent advice about different trading strategies, here are some advisors that can help point you in the right direction.
Double top and double bottom trading philosophy
Let’s review how traders would respond to a double-top or double-bottom pattern.
When to open a trade
First, remember that double tops and double bottoms will take longer to form than other patterns. There might be a further reduction in volatility near the breakout point. Many conservative traders will say to wait to open a trade until after the pattern has broken out and possibly for a further reduction of volatility. Some would say that it might be wise to wait until the bottom or top of the candlestick that broke out of the pattern. Or until another candlestick during the further consolidation time when volatility would be reduced. As double tops and double bottoms are reversal patterns of extended bearish or bullish trends, analysts might recommend waiting until the pattern has definitely broken out before opening a trade.
How to manage the downside
Where traders put their buy stops depends on the type of trader they are. In the case of a double top M, a buy stop above the higher end of the two peaks would indicate an aggressive stance. The trader is willing to let the price swing up a bit in the hope that it swings back down into the pattern. More conservative traders would opt to put a buy stop close to the lower of the two peaks in case the pattern is the continuation of an uptrend and not a reversal.
Real-life example: Dot-com bubble
As double-top and double-bottom patterns are usually large reversal trends with a long consolidation time, there are periods throughout history in which you can locate them and their prior trend. One of the most famous is the dot-com bubble in the U.S.
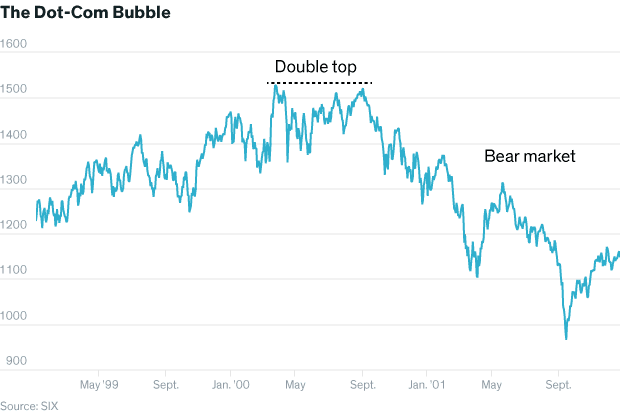
Here you can see an uptrend from the beginning of Q2 1999. The first peak forms around April/May 2000 and August/September 2000. After the price hits’ the second peak (as pushed up by the buyers who supported the bull market beforehand), it begins to descend. It descended through the breakout point and led to the bear market, which happened in tandem with the dot-com bubble bursting and the subsequent recession.
FAQ
What is a double bottom pattern?
A double-bottom pattern is generally considered a bullish reversal pattern. The pattern occurs toward the bottom of an extended downtrend and indicates a price breakout to the upside.
Is the double-bottom pattern bullish?
Yes, a double-bottom pattern is considered a bullish reversal trend.
How do you play a double-bottom pattern?
This is all up to the trader. The trader might want to wait until after the price breaks out of the pattern to open up a long position. They might manage the downside by putting a stop loss lower than the lowest bottom if they are aggressive or closer to the higher previous low if they are cautious.
How reliable is the double bottom pattern?
The double bottom pattern is reliable; the trick is actually identifying it. As the pattern emerges after a long continuation trend, it’s important to truly identify it in order to signal a reversal. You don’t want to buy or short while the original trend continues.
Is a triple bottom bullish?
Yes, a triple bottom is generally considered a bullish pattern.
What happens after the double bottom pattern?
If the pattern is correct, then the price should break out to the upside.
How do I know if I have a double-top pattern?
Some traders would recommend waiting until the pattern is confirmed with a break of the neckline and maybe a retest to make sure. If the peaks are around the same level but do not necessarily match, and the trough in the middle when the price falls is not too understated or overstated, this could be a complete pattern.
Key takeaways
- Double top and double bottom chart patterns will look like either an “M” in the case of a double top or a “W” in the case of a double bottom.
- The pattern will emerge after a long continuation trend, either up or down. The pattern indicates a reversal in either direction.
- Typically the consolidation time for these patterns is longer than for other patterns.
- The patterns are hard to identify, and traders recommend opening a trade after the price has broken out of the pattern shape.
Share this post: