Sharpe Ratio: A Guide to Measuring Risk-Adjusted Returns
Summary:
The Sharpe ratio is a widely used metric in finance that measures the risk-adjusted return of an investment and provides a way to compare the risk-adjusted performance of different investments. A higher Sharpe ratio generally indicates better risk-adjusted performance, while a lower ratio may indicate that an investment won’t generate enough return for the risk you’d take on.
Investing is a great way to build wealth over time, but it’s not without its risks. As an investor, it’s important to understand how to measure the risk and return of your investments. One metric that can help you do this is the Sharpe ratio.
Developed by Nobel laureate William F. Sharpe in 1966, the Sharpe ratio has become one of the most widely used metrics in finance. In this post, we’ll explain what the Sharpe ratio is, how it’s calculated, and how you can use it to measure the risk-adjusted return of an investment.
What is the Sharpe ratio?
The Sharpe ratio is a measure of the risk-adjusted return of an investment. It takes into account both the return and the risk of an investment, which makes it a useful tool for comparing investments with different levels of risk. The Sharpe ratio was developed by Nobel laureate William F. Sharpe in 1966 and has become one of the most widely used metrics in finance.
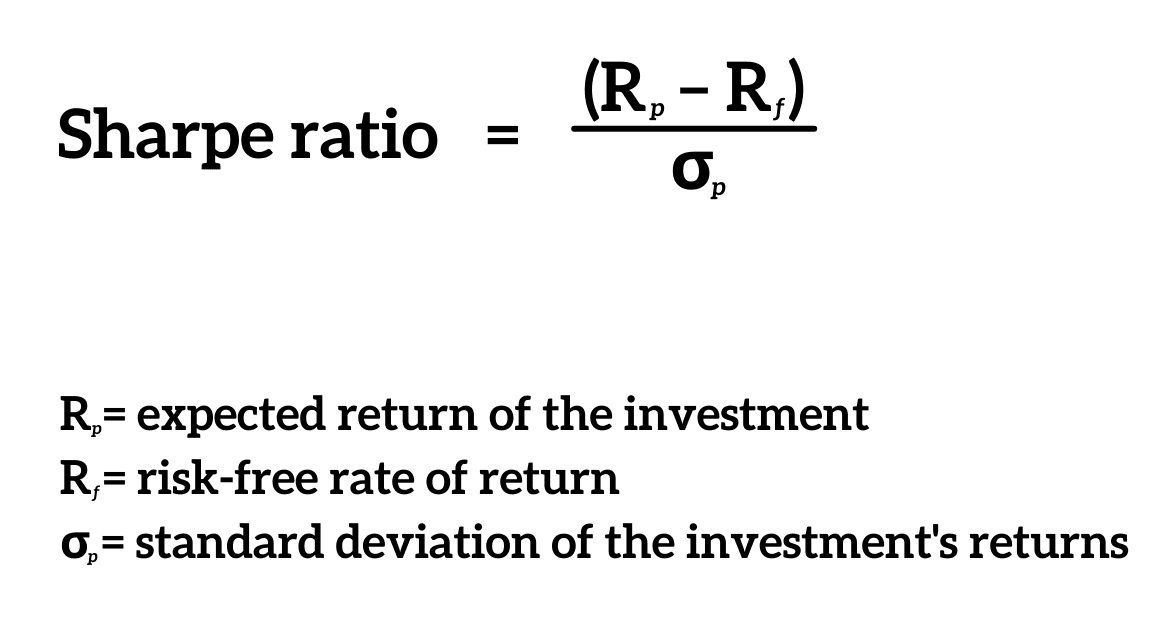
The Sharpe ratio compares the excess return of an investment above the risk-free rate to the investment’s volatility, as measured by its standard deviation. The excess return is the return on the investment minus the risk-free rate, which is usually the yield on a government bond. The standard deviation of returns measures the volatility of the investment’s returns. By dividing the excess return by the standard deviation, the Sharpe ratio tells you how much excess return you get for each unit of risk you take on.
The Sharpe ratio is a valuable tool for investors because it allows them to compare the risk-adjusted returns of different investments. When comparing two investments, the one with the higher Sharpe ratio is generally the better investment, as it generates more excess return for the risk.
IMPORTANT! However, it’s important to keep in mind that the Sharpe ratio is just one metric and should not be the only factor considered when making investment decisions. For instance, don’t forget to consider factors such as the investment’s liquidity, fees, and the investor’s risk tolerance.
How is the Sharpe ratio calculated?
To calculate the Sharpe ratio, you need to divide the excess return of an investment by its volatility, as measured by its standard deviation.
Let’s break down the formula further:
- Calculate the excess return of the investment. The excess return is the difference between the investment’s return (R) and the risk-free rate of return (R). It represents the additional return an investor gets for taking on the risk of the investment.
- Calculate the standard deviation of the investment’s returns. The standard deviation measures the volatility of the investment’s returns. It tells you how much the investment’s returns vary from the average return. You can calculate the standard deviation using historical returns data.
- Divide the excess return by the standard deviation. By dividing the excess return by the standard deviation, we get the Sharpe ratio.
What does this ratio tell you?
The Sharpe ratio tells you how much excess return you get for each unit of risk you take on. A higher ratio indicates that an investment may generate more excess return for the amount of risk the investor takes on, while a lower number indicates that an investment could generate less excess return for the risk.
Because of this, the Sharpe ratio is a useful tool for comparing investments with different levels of risk. For example, let’s say you want to compare two mutual funds, one with a higher risk and higher return, and the other with a lower risk and lower return. You can use the Sharpe ratio to determine which one could generate more excess return for the risk. You can also use the Sharpe ratio to evaluate the performance of a single investment over time.
What does a Sharpe ratio of 0.5 mean?
A Sharpe ratio of 0.5 means that an investment generates 0.5% of excess return per unit of risk (usually measured by standard deviation). It suggests that the investment isn’t generating a significant amount of return for the risk.
Comparatively, a ratio of 1.5 means that an investment generates 1.5% of excess return per unit of risk. It suggests that the investment may generate a high return for the amount of risk it takes on, making it an attractive investment option on a risk-adjusted basis.
Uses and limitations of the Sharpe ratio
The Sharpe ratio is a useful tool for making investment decisions because it allows investors to compare the risk-adjusted returns of different investments. However, it also has some limitations that investors should be aware of.
Uses explained
- Comparing investments. When comparing two investments, investors generally consider the one with the higher Sharpe ratio to be the better investment. This is because it could generate more excess return for the amount of risk.
- Portfolio optimization. Investors can use the Sharpe ratio to optimize a portfolio by identifying investments that generate the most excess return for the risk. By constructing a portfolio that maximizes this ratio, investors can achieve a higher return for the level of risk they are comfortable with.
- Evaluating investment performance. By calculating the Sharpe ratio for an investment over a period of time, investors can determine whether the investment will generate a higher excess return for the amount of risk.
- Risk management. Finally, this calculation can be used to manage risk by identifying investments that generate too little excess return for the risk. Investments with a low Sharpe ratio may not be worth the risk and should be re-evaluated.
Limitations explained
- Historical data bias. This ratio is based on historical returns data, which may not be indicative of future returns. Just because an investment has a high Sharpe ratio in the past doesn’t mean it will continue to have a high ratio in the future.
- Normal distribution assumption. The Sharpe ratio assumes that the returns of an investment are normally distributed, meaning they follow a bell-shaped curve. However, in reality, many investments don’t have this distribution, which can affect the accuracy of the Sharpe ratio.
- Lack of consideration for extreme events. This calculation doesn’t consider extreme events or “fat-tail” events, which can have a significant impact on an investment’s returns. These events, such as market crashes or sudden geopolitical events, can have a much larger impact than what the standard deviation predicts.
- Dependence on the risk-free rate. The Sharpe ratio is dependent on the risk-free rate of return, which can vary over time and may not be a true representation of the risk-free rate. In addition, the risk-free rate may not be relevant for all investors, as some investors may have a different risk tolerance or may have access to investments with different risk profiles.
- Lack of consideration for diversification. The ratio does not take into account the benefits of diversification. A portfolio with a lower Sharpe ratio may actually be a better investment if it’s well-diversified, as it may have a lower overall risk than a portfolio with a higher ratio.
Despite these limitations, the Sharpe ratio remains a valuable tool for investors to use when evaluating risk-adjusted returns. However, investors should always consider the limitations of the Sharpe ratio and use it in conjunction with other metrics and analyses when making investment decisions.
Key Takeaways
- The Sharpe ratio is a metric used in finance to measure the risk-adjusted return of an investment. It measures how much return an investment generates in excess of the risk-free rate per unit of risk.
- A higher ratio is generally better, as it indicates that an investment could generate more excess return per unit of risk.
- Investors should consider the Sharpe Ratio in conjunction with other metrics and analyses when making investment decisions.
Table of Contents