
Industry Study
2026 Consumer Credit Card Industry Study
Summary:
Credit cards are the most common credit product in the U.S., held by 78% of adults, with total revolving credit reaching $1.33 trillion as of January 2026. When adjusted for inflation, however, today’s debt is still about 9% below the 2008 crisis peak. Average APRs remain near historic highs at 20.97%, consumers paid an estimated $181 billion in interest charges in 2025, and roughly 111 million Americans carry a balance from month to month.
Over the course of a generation, credit cards have become America’s most popular form of credit. 78% of U.S. adults have at least one credit card, according to the CFPB’s 2025 Consumer Credit Card Market Report, and there are nearly 800 million credit card accounts in the country. We spend trillions of dollars and take on billions of dollars of debt each year using hundreds of millions of credit cards.
This industry study takes a deep dive into the credit card landscape and its effect on consumers’ personal finances, using the latest data from the Federal Reserve, the New York Fed, the CFPB, and other authoritative sources.
Compare Credit Cards
Compare the rates, fees, and rewards of leading credit cards.
Key credit card statistics and takeaways
- Total revolving credit reached $1.33 trillion in January 2026 — a new nominal record, per the Federal Reserve’s G.19 release. However, adjusted for inflation, debt remains about 9% below the 2008 peak.
- Total credit card balances hit $1.277 trillion in Q4 2025, up 38% from the pre-pandemic record of $927 billion in Q4 2019, according to the Federal Reserve Bank of New York.
- Roughly 111 million Americans — about 50% of active cardholders — carry credit card debt from month to month, according to a 2026 report by The Century Foundation and Protect Borrowers.
- Americans paid an estimated $181 billion in credit card interest charges in 2025, more than double the $75 billion paid in 2021.
- The average APR across all credit card accounts was 20.97% in Q4 2025, down from a peak of 21.47% in Q4 2024 following six Federal Reserve rate cuts. New card offers an average 23.72%.
- The 30-day delinquency rate fell to 2.94% in Q4 2025 — the sixth consecutive quarterly decline — though the charge-off rate rose to 4.03%.
- 15% of general-purpose cardholders made only the minimum payment in 2024, the highest level since at least 2015, per the CFPB.
- Consumers with incomes above $100,000 prefer credit cards over debit cards; below that threshold, debit cards dominate.
- Consolidating credit card debt is the top reason borrowers qualify for a personal loan on SuperMoney.
- Rewards are the most attractive feature for consumers shopping for credit cards.
$1.33 trillion in credit card debt sounds scary. Here’s what the data actually shows.
Total revolving credit — which includes credit cards and other revolving accounts like home equity lines of credit — reached $1.33 trillion in January 2026, according to the Federal Reserve’s G.19 release. That’s a new nominal record.![Total Revolving Credit Outstanding — Nominal vs. Inflation-Adjusted]](/_next/image?url=https%3A%2F%2Fcdn-blog.supermoney.com%2Fwp-content%2Fuploads%2F2018%2F04%2FCredit-Card-Debt-Scary-1-1024x1024.png&w=3840&q=75)
But context matters. When you adjust for inflation using the CPI, today’s revolving credit total is still roughly 9% below the peak reached during the 2008 financial crisis. The economy is larger, the population has grown, and wages — while not keeping pace with everything — are higher in absolute terms. As WalletHub’s analysis shows, the ratio of credit card debt to bank deposits is 61% below its 2000 peak, and the ratio of debt to household assets is 51% below its 2002 peak.
That said, record-high nominal debt combined with near-record APRs means the cost of carrying that debt has never been greater — which is why the interest charge figures are arguably more alarming than the debt totals themselves.
Total credit card balances: $1.277 trillion in Q4 2025
The Federal Reserve Bank of New York’s Quarterly Report on Household Debt and Credit — which tracks credit card balances specifically, separate from the broader G.19 revolving credit measure — shows total credit card balances reached $1.277 trillion in Q4 2025. That’s up from $1.233 trillion in Q3 2025 and represents a 38% increase over the pre-pandemic record of $927 billion in Q4 2019.

Credit card balances have risen by $507 billion since bottoming out at $770 billion in Q1 2021, when stimulus payments and reduced spending drove a historic paydown. The total rose by $93 billion in 2025 alone — a 116% increase over the $43 billion added in 2024, per WalletHub’s analysis. The Q4 2025 increase of $73 billion was roughly double the Q4 2024 figure.
Total household debt reached $18.8 trillion in Q4 2025, with credit cards accounting for about 6.8% of the total.
111 million Americans carry credit card debt
According to a March 2026 report by The Century Foundation and Protect Borrowers, roughly 111 million Americans — about 50% of those with a credit card and 40% of all U.S. adults — are unable to pay their credit card bill in full and carry a balance month to month. That represents a 17% increase from the 95 million who were in the same situation five years earlier.

The Federal Reserve’s most recent Survey of Household Economics and Decisionmaking (SHED), using 2024 data, found that 46% of credit card holders carried a balance at some point during the year. Among those carrying debt, more than 27 million can only afford the minimum payment each month.
The CFPB’s 2025 Consumer Credit Card Market Report found that 15% of general-purpose cardholders and 20% of private-label cardholders made only the minimum payment in 2024 — the highest levels observed since at least 2015.
Once a consumer starts carrying a balance, they tend to continue. Prime borrowers carry a revolving balance for an average of 9 months, subprime borrowers for 13 months, and 12–20% of consumers take 2 years or more to repay, according to CFPB data.
Credit card APRs surged to historic highs and are now declining
Credit card interest rates reached 16.98% in 2019 before dropping during the pandemic. Rates then surged as the Fed raised rates — seven hikes in 2022 and four more in 2023 — peaking at 21.47% across all accounts in Q4 2024, per the Federal Reserve G.19 release.

Following three Fed rate cuts in late 2024 and another three in late 2025, the average APR has declined to 20.97% across all accounts and 22.30% for accounts assessed interest as of Q4 2025. The Fed held rates steady at its January 2026 meeting and is expected to pause through at least April 2026.
If you’re shopping for a new card, expect to pay more: the average APR on new credit card offers is 23.72%, according to LendingTree’s March 2026 tracker. Rates vary significantly by card type — low-interest cards average 17.77%, while secured cards average 26.13%.
Many credit card issuers offer promotions to appeal to new customers, including 0% APR promotions on new purchases, balance transfers, or both. However, consumers should understand the difference between true 0% APR offers and deferred interest promotions, where failing to pay the full balance by the due date triggers retroactive interest on the original purchase amount.
Americans paid $181 billion in credit card interest in 2025
The combination of record-high balances and near-record APRs has driven interest charges to unprecedented levels. According to WalletHub’s Q4 2025 analysis, credit card finance charges totaled an estimated $181 billion in 2025 — up from $160 billion in 2024 (per the CFPB), $105 billion in 2022, and just $75 billion in 2021.
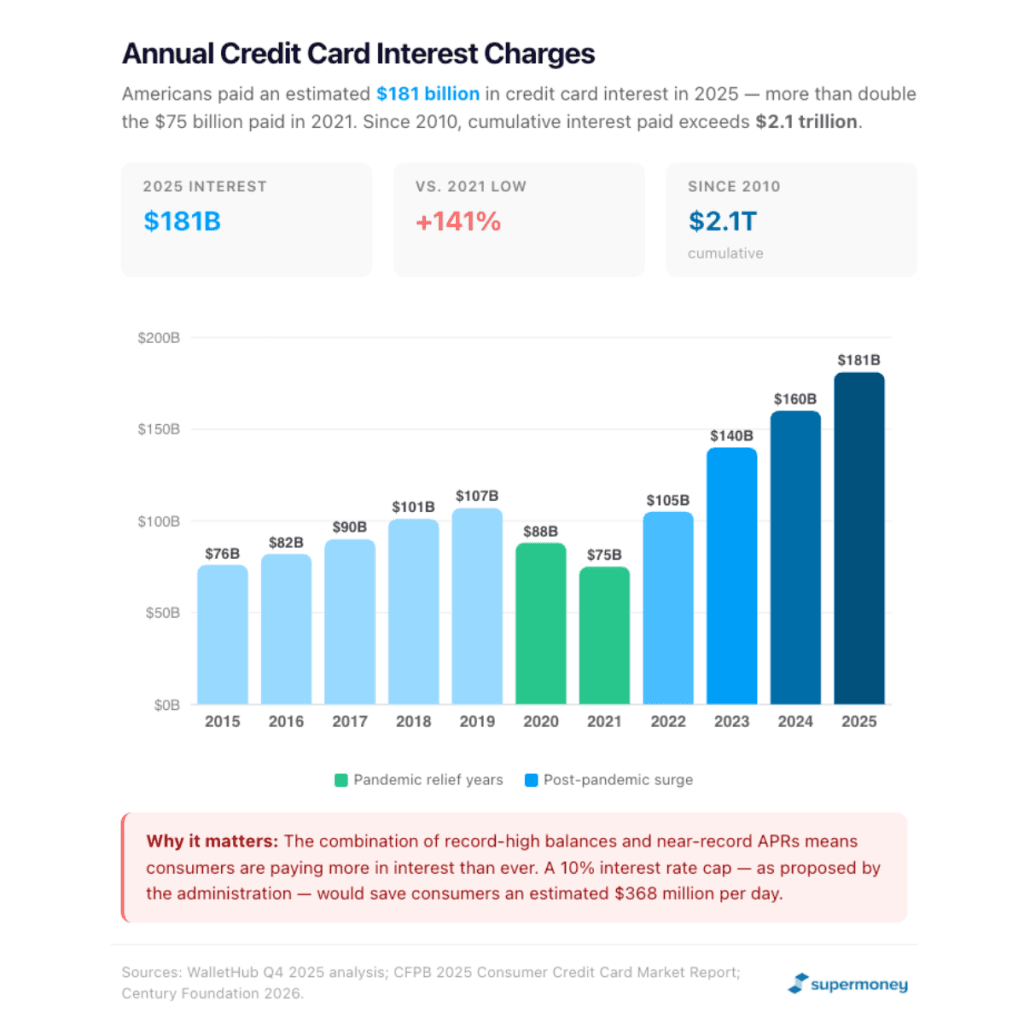
The Century Foundation estimates that Americans have paid a cumulative $2.1 trillion in credit card interest since 2010 — more than the total amount of outstanding student loan debt. A proposed 10% interest rate cap, floated by the administration in January 2026, would save consumers an estimated $368 million per day, according to the report.
Delinquency rates have declined, but charge-offs tell a different story
Delinquency rates on credit cards fell to a historic low of 2.12% in Q4 2020, driven by stimulus payments and reduced spending. They subsequently climbed for 11 consecutive quarters, peaking in mid-2024, before declining for six straight quarters to 2.94% in Q4 2025, per the Federal Reserve.
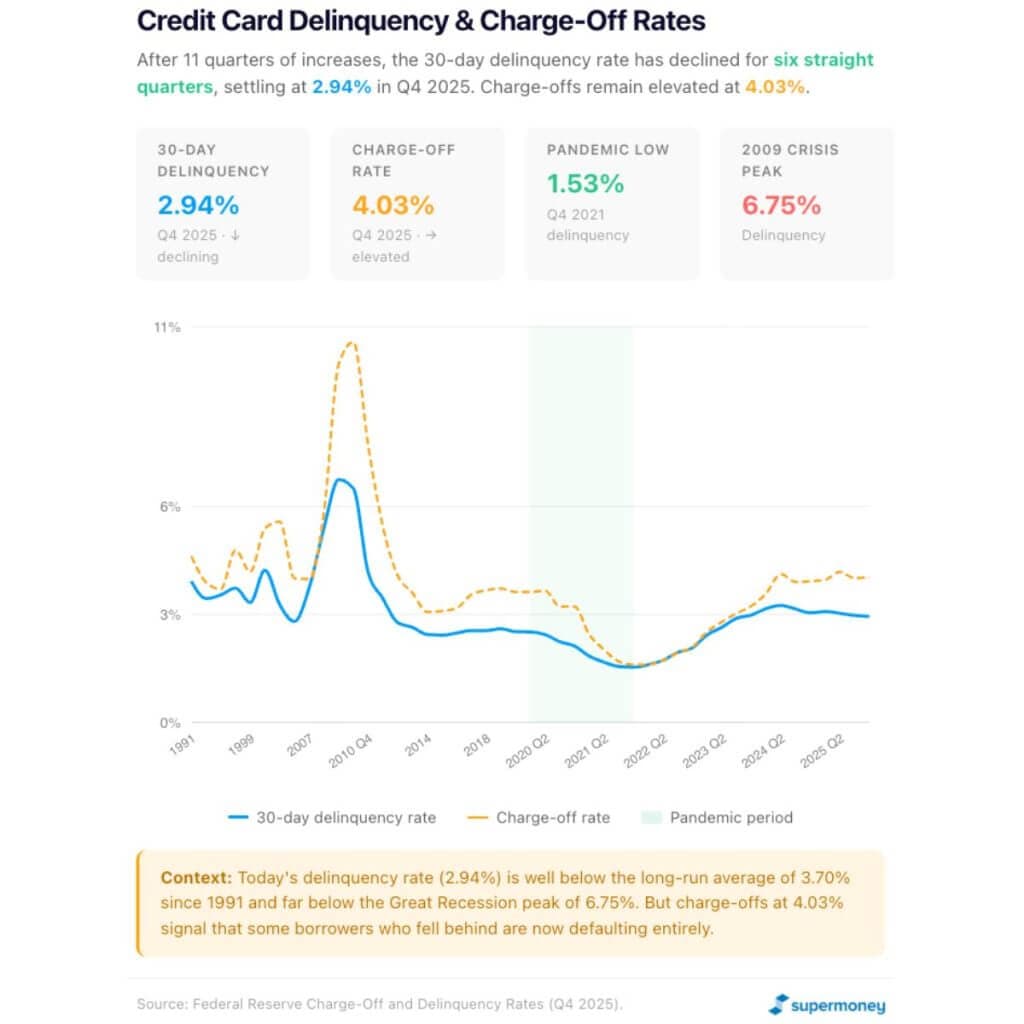
Today’s delinquency rate is well below the long-run average of 3.70% (since 1991) and far below the Great Recession peak of 6.75% in 2009.
However, the charge-off rate — the percentage of balances that banks write off as losses — rose to 4.03% in Q4 2025. This divergence suggests that while fewer borrowers are newly falling behind (lower delinquency), those who fell behind earlier are now defaulting entirely (higher charge-offs). Credit card loans account for less than 10% of all bank loans and leases but generate nearly 70% of all net charge-off expenses, according to FDIC data cited by the American Enterprise Institute.
Issuer profitability is compressing while consumers pay record interest
Despite consumers paying record interest charges, credit card issuer profitability has declined. The Federal Reserve’s 2025 report on profitability of credit card operations shows that the return on assets (ROA) for major credit card banks fell from a pandemic-era peak of 9.6% in 2021 to 5.9% in 2022, 3.33% in 2023, and an estimated 2.8% in 2024.
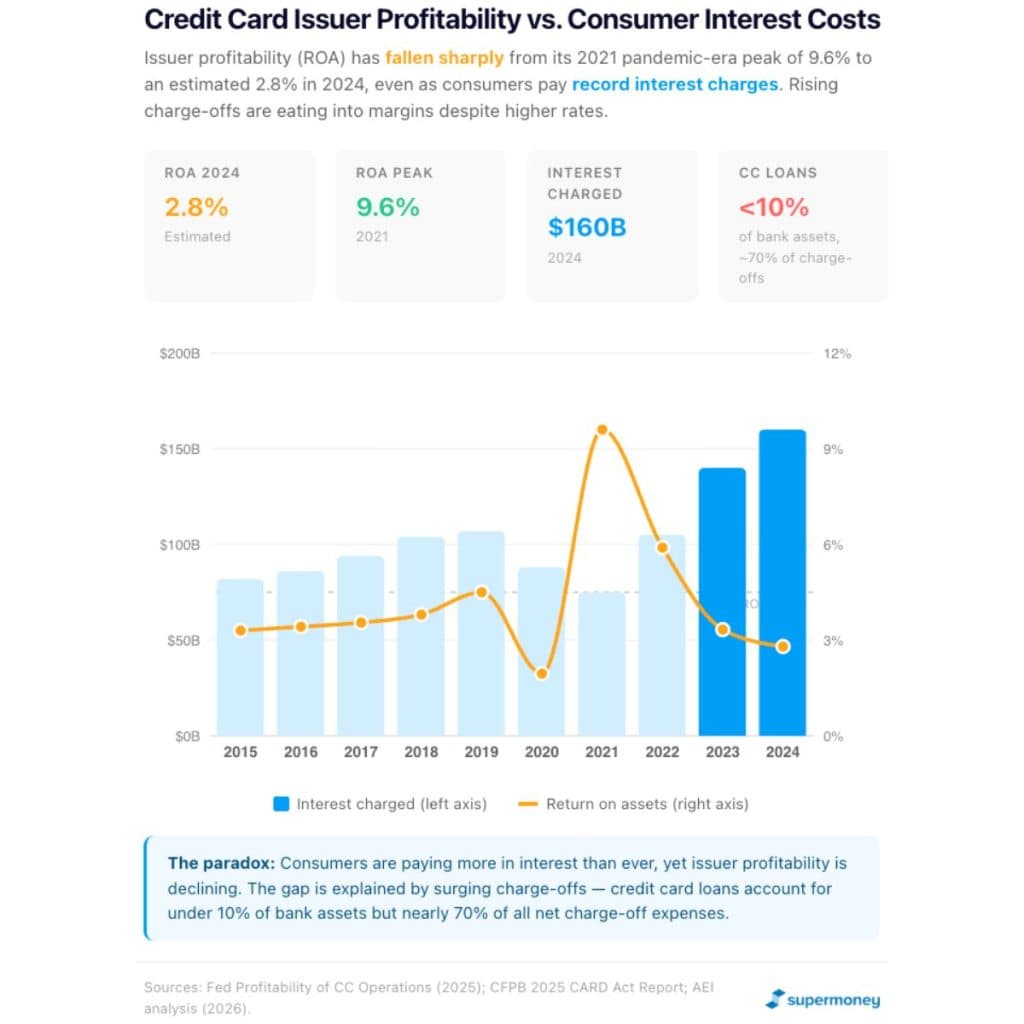
The explanation for this seeming paradox: rising charge-offs are eating into margins. As more borrowers default, banks must set aside larger provisions for loan losses, offsetting the gains from higher interest income. The CFPB noted that the top 10 credit card issuers hold roughly 84% of outstanding balances — a concentration level that has remained stable since 2016.
78% of Americans have at least one credit card
Credit card ownership is widespread and growing. The CFPB’s 2025 report found that 78% of U.S. adults hold at least one credit card. The Federal Reserve’s 2025 profitability report puts the figure at 81%. There are nearly 800 million credit card accounts nationwide, over three-fourths of which are general-purpose cards.
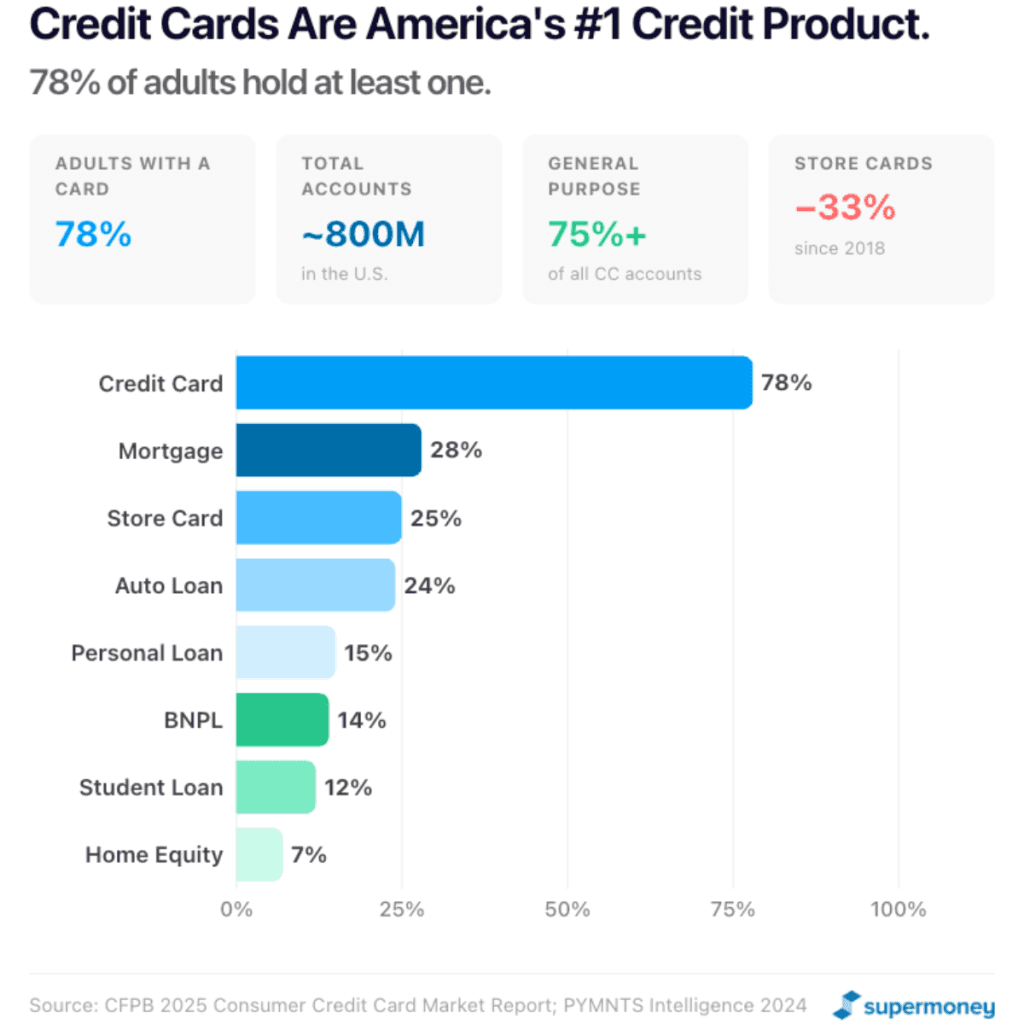
The number of general-purpose credit card accounts has consistently increased, while private-label (store) card accounts have declined by over 33% since 2018, per the CFPB. Credit card usage has grown steadily since 2010, with only a brief pause during the pandemic.
Consumers with incomes above $100K prefer credit cards
Debit cards are the most popular form of payment overall, but the preference flips for higher-income consumers. Those with annual incomes above $100,000 prefer credit cards over debit cards. This pattern is consistent across recent Fed survey data.
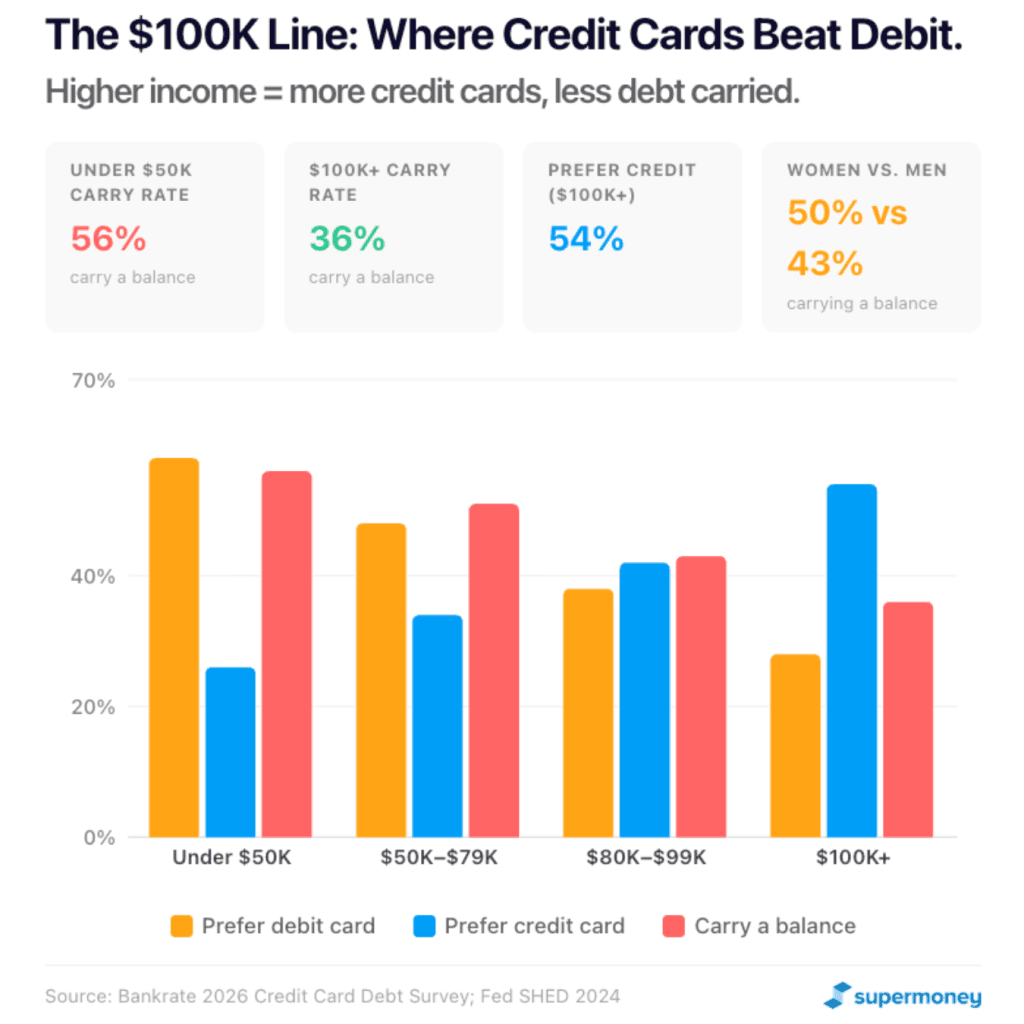
According to a Bankrate 2026 survey, 56% of cardholders with household incomes under $50,000 carry a balance month to month, compared to just 36% of those earning more than $100,000. There’s also a gender gap: 50% of female cardholders carry a balance versus 43% of male cardholders.
The average credit card balance: it depends on how you measure it
Credit card balance figures vary widely depending on the source and what’s being measured:
- $6,735 per person — Experian’s average for conventional credit cards and store cards combined, as of June 2025.
- $7,886 per cardholder with an unpaid balance — LendingTree’s Q3 2025 analysis of 400,000+ credit reports, covering only those who carry a balance.
- $11,036 per household — WalletHub’s February 2026 figure, adjusted for inflation, which accounts for multiple cardholders per household.
All three figures are at or near record highs. The average balance varies significantly by state: Connecticut leads at $9,778 per cardholder, while Mississippi has the lowest at $4,887, according to LendingTree’s Q3 2025 data.
Connecticut has the highest average credit card debt
The state-by-state picture has shifted significantly. LendingTree’s analysis of over 400,000 credit reports from Q3 2025 shows Connecticut, New Jersey, and Maryland now lead the nation in average credit card debt — a departure from earlier years when Alaska consistently topped the rankings.
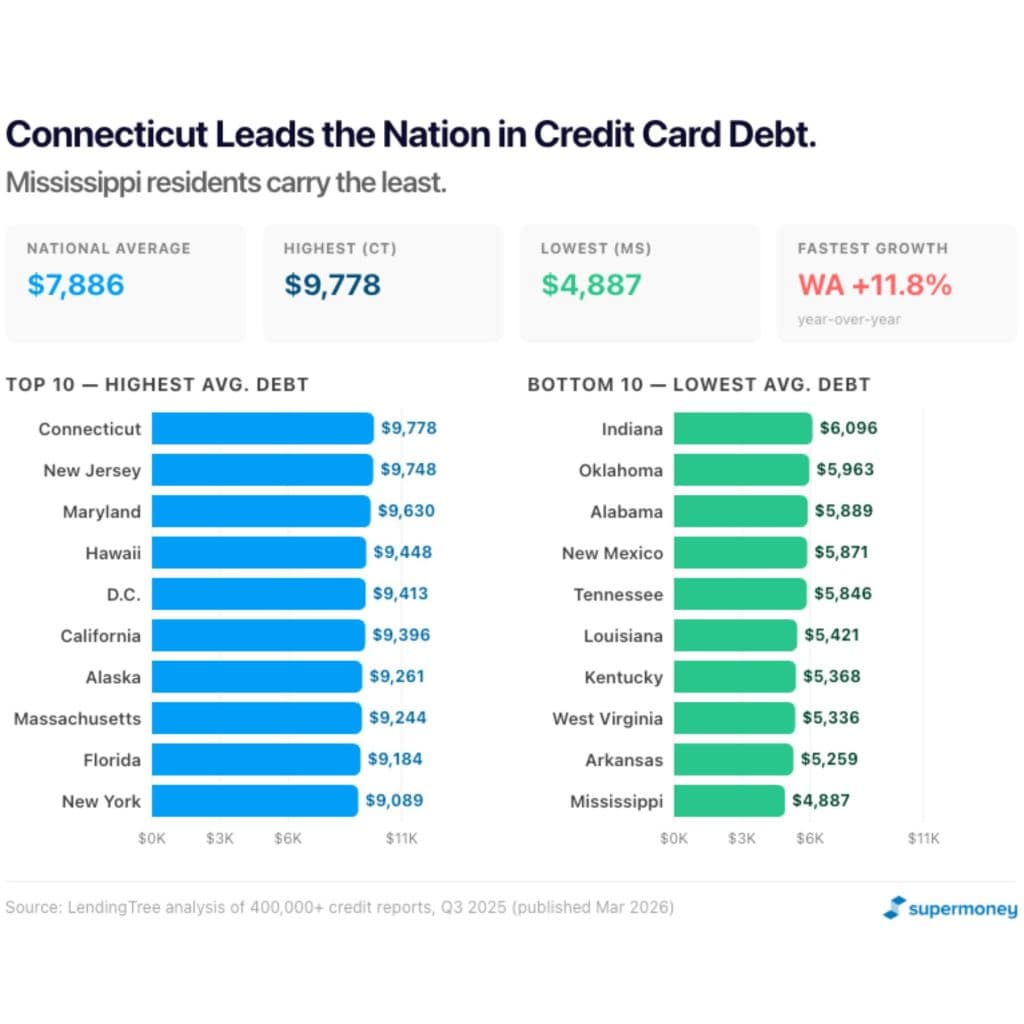
The top five states are Connecticut ($9,778), New Jersey ($9,748), Maryland ($9,630), Hawaii ($9,448), and Washington D.C. ($9,413). The bottom five are Mississippi ($4,887), Arkansas ($5,259), West Virginia ($5,336), Kentucky ($5,368), and Louisiana ($5,421).
Washington state saw the fastest growth, with average card debt rising 11.8% year-over-year. Seven states saw balances decrease, led by New Mexico (down 10.3%).
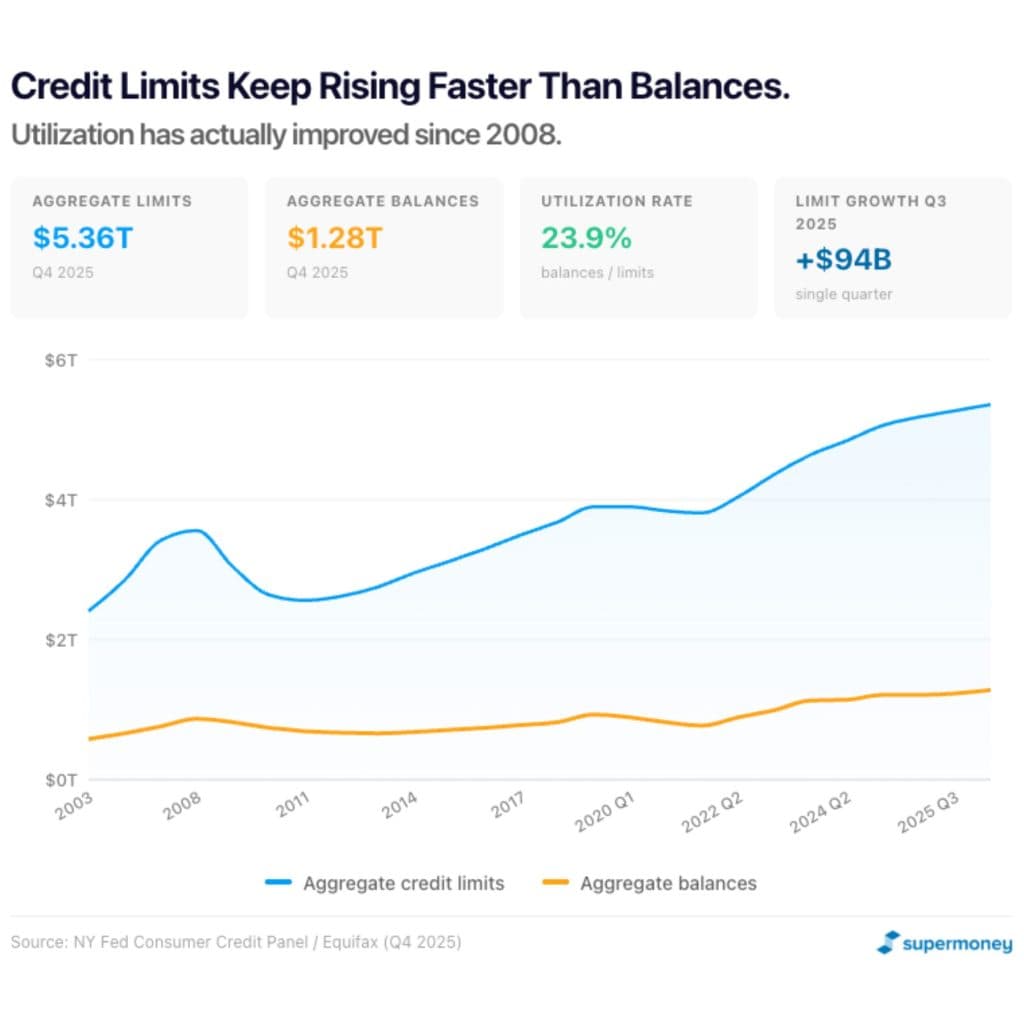
Credit card limits keep rising
The average credit card limit increased from $20,265 to $22,589 in 2020, and aggregate limits have continued rising. The Federal Reserve Bank of New York reported limits grew by $94 billion in Q3 2025 alone.
Credit limits by credit score tier, per the American Bankers Association:
- Super prime (781–850): $10,396 average on new accounts
- Prime (661–780): $5,692
- Subprime (500–600): $2,566
If you don’t get the credit limit you need, consider requesting a credit line increase. Some issuers, like Capital One, offer automatic credit limit increases.
Gen X carries the most credit card debt
Generation X leads all generations in average credit card debt — and the gap is widening. According to Experian’s June 2025 consumer credit data, those ages 45–60 carry an average credit card balance of $9,600, a $2,600 increase from just three years ago.
Millennials (ages 29–44) now carry $6,961 on average — crossing over baby boomers ($6,795) for the first time. Gen Z (under 29) carries the least at $3,493, but their balances have grown 78% since 2021 — the fastest rate of any generation.
Meanwhile, boomers’ balances are declining for the first time, though they’re the generation most likely to miss a credit card payment — 41% skipped at least one in 2025, according to a U.S. News survey. And over 20% of Gen Z consumers say they never use a credit card at all, preferring debit cards and buy now, pay later plans to avoid debt.

Younger consumers are increasingly using credit cards for everyday necessities — groceries, gas, and rent — rather than discretionary spending, as prices remain volatile and housing costs consume a larger share of income. Credit card debt also represents a disproportionately large share of total debt for younger adults. While millennials carry less total debt than Gen X, credit card balances make up a larger percentage of their overall debt burden.

The demographics of credit card debt
The following sections draw on the Federal Reserve’s 2022 Survey of Consumer Finances (SCF) — the most comprehensive source of demographic data on American household finances. The SCF is conducted every three years, and the 2022 survey is the most recent available. The next survey, covering 2025 data, is currently being conducted and is expected to be released in late 2026 or early 2027. Until then, the 2022 SCF remains the authoritative source used by government agencies, researchers, and all major publications for demographic breakdowns of credit card debt.
Overall, 45.2% of American families carried a credit card balance in 2022. The median balance among those carrying debt was $2,700, and the mean was $6,120 — both down noticeably from 2019, reflecting the impact of pandemic-era stimulus payments and reduced spending.
Families are more likely to carry a balance, but for smaller amounts
The percentage of families carrying a credit card balance grew from 38% in 2013 to 44% in 2016 and reached 45.2% in 2022. However, the median balance among those carrying debt actually declined — from $3,100 in 2019 to $2,700 in 2022. More families are carrying balances, but for smaller amounts, a trend driven by pandemic-era paydowns that have since reversed as balances surged in 2023–2025.


Couples with children are the most likely to carry a balance and the biggest borrowers
Couples with children are the most likely family type to carry a credit card balance at 55.4%, closely followed by single parents at 54.0%. But the financial burden differs significantly: couples with children carry a median balance of $3,400 and a mean of $7,050, while single parents carry just $1,900 (median) — reflecting lower credit limits and incomes rather than greater financial discipline.
Couples without children are the least likely to carry a balance at 38.9%, but when they do, their median balance of $2,800 and mean of $6,540 are substantial.

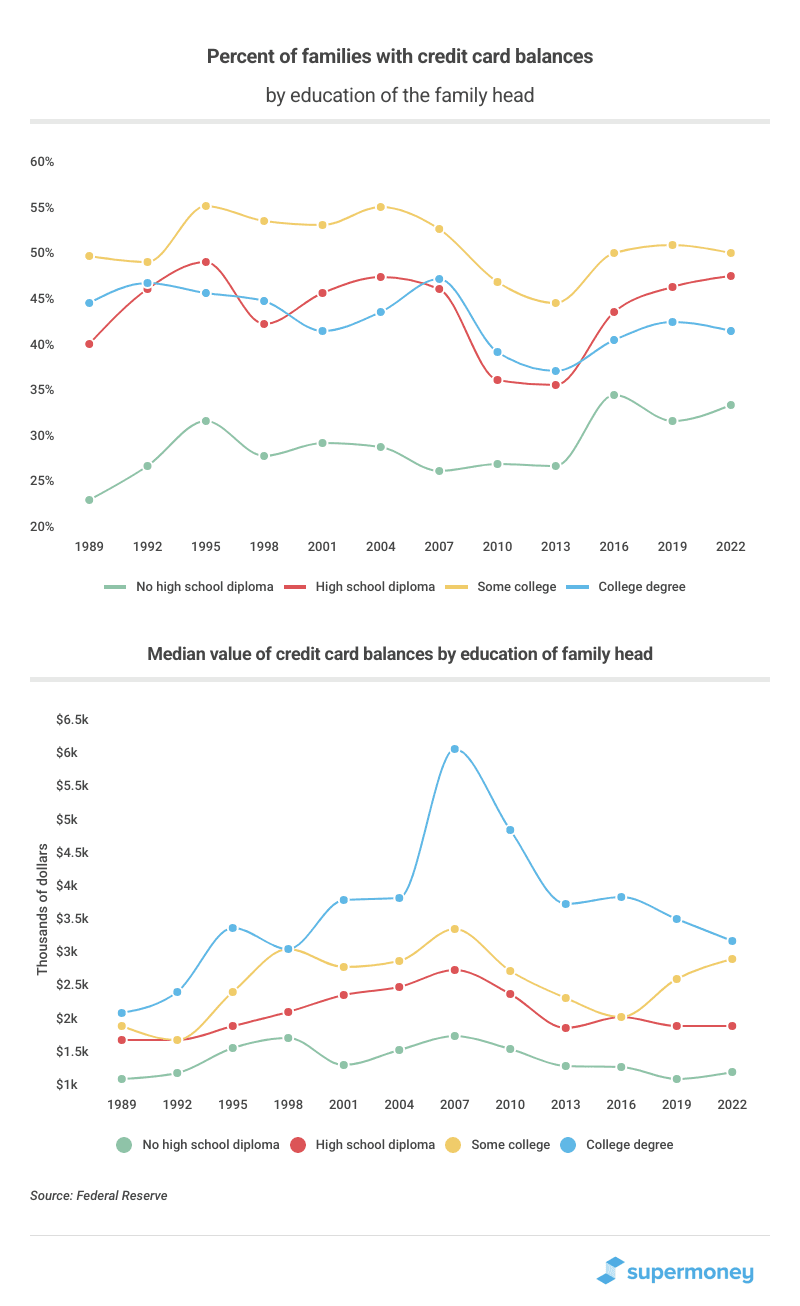
College graduates owe the most, but those with some college are most likely to carry debt
Household heads with some college education are the most likely to carry a balance at 50.8%, followed by those with only a high school diploma at 48.3%. But those with a college degree, while less likely to carry (42.2%), owe significantly more when they do — a median of $3,270 and a mean of $7,270, nearly double those without a high school diploma ($1,300 median / $4,390 mean).
This pattern reflects higher credit limits and incomes among college graduates, which enable larger balances even as better financial literacy may help some avoid carrying debt altogether.
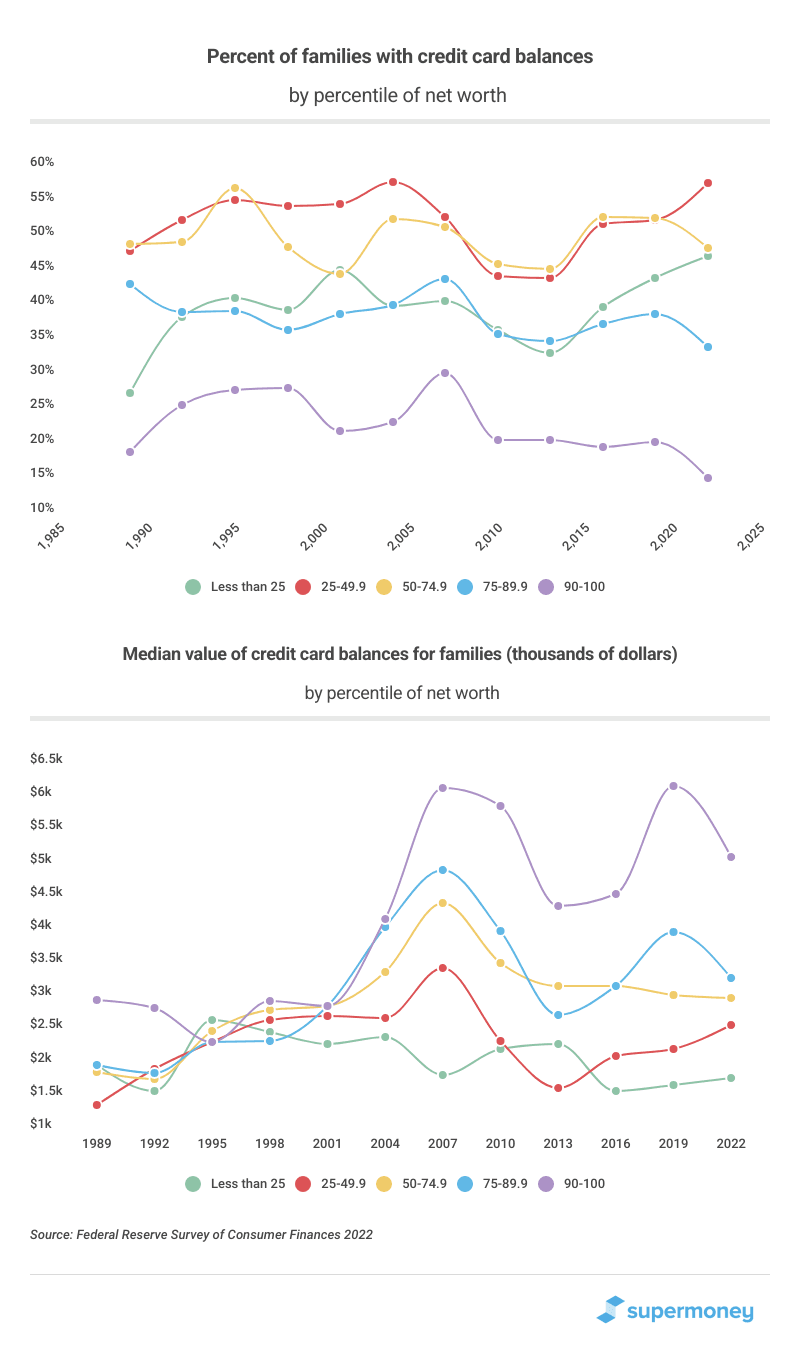
Middle-class consumers carry balances most often; the wealthy carry the largest
Net worth is a powerful predictor of credit card behavior. Families in the 25th–50th percentile of net worth are the most likely to carry a balance at 58.0%, while those in the top decile (90th+ percentile) are the least likely at just 15.4%.
But when wealthy families do carry a balance, it’s large: the median for the 90th+ percentile is $5,130 and the mean is $13,160 — more than double any other net worth group. Meanwhile, families in the bottom quartile carry a median of just $1,800 despite being nearly as likely to have a balance (47.5%).
Families with a household head in a managerial profession are less likely to carry a credit card balance (49.3%) than those in technical, sales, or service occupations (52.5%), but the balances they carry are 56% higher ($3,500 vs. $2,250 median).
Homeowners carry larger balances than renters
Renters and homeowners carry credit card balances at nearly identical rates — 45.9% for renters versus 44.9% for owners. But the amounts diverge sharply: homeowners who carry a balance owe a median of $3,300 and a mean of $7,170, compared to just $1,600 median and $4,140 mean for renters.
This reflects homeowners’ higher incomes and credit limits, which allow larger revolving balances. Renters, who tend to be younger with lower incomes (source) and lower credit scores, carry less debt in absolute terms despite being slightly more likely to revolve.

Black and Hispanic consumers are more likely to carry a balance; White consumers carry larger balances
Race remains a predictor of income and credit score disparities, which is clearly reflected in credit card data. Black non-Hispanic families (56.3%) and Hispanic families (55.8%) are significantly more likely to carry a balance than White non-Hispanic families (42.2%).
However, White families who carry a balance owe substantially more: a median of $3,000 and a mean of $6,930, compared to $1,700 median / $4,360 mean for Black families and $1,700 median / $4,150 mean for Hispanic families. This pattern reflects broader disparities in income, wealth, and access to credit that result in higher credit limits — and therefore higher potential balances — for White families.

Rewards are the most attractive feature for consumers shopping for credit cards
Credit card rewards have become the dominant factor in card selection. Balance transfer options and card brands are becoming less important relative to cash back, points, and travel perks.

According to the ABA’s Credit Card Market Monitor, 42.4% of credit card holders are “revolvers” who carry a balance month to month, 29.1% are “transactors” who pay in full each month, and 27.2% are “dormants” who didn’t use their cards in the previous quarter.
Consolidating credit card debt is the top reason borrowers qualify for a loan
SuperMoney generates tens of thousands of personal loan applications per month. The most popular loan reason among borrowers who get a pre-approved loan offer is debt consolidation. Credit card debt consolidation specifically makes up the large majority of debt consolidation loan applications.

Read this in-depth report of the consumer lending industry for the latest statistics and insights on the personal loans market.
A brief history of credit cards
The concept of consumer credit dates to 3,500 B.C. in ancient Sumer, where cylinder seals worn around the neck served as personal guarantees during business deals. Modern credit cards emerged in the 1920s when department stores began offering metal charge plates, and Frank McNamara launched the first multi-merchant card — Diners Club — in 1950.
The industry exploded from there: American Express and Bank of America entered in 1958, BankAmericard became Visa in the 1960s, the Interbank Card Association became Mastercard, and Sears launched the first rewards credit card (Discover) in 1986. Today, signup bonuses worth hundreds of dollars and extensive rewards programs have made credit cards the most popular form of both payment and credit.
Methodology and sources
This study draws on the following primary data sources:
- Federal Reserve G.19 Consumer Credit release — Monthly revolving credit totals; quarterly APR data. Latest: January 2026.
- Federal Reserve Bank of New York Household Debt and Credit Report — Quarterly credit card balance totals from the Consumer Credit Panel (Equifax). Latest: Q4 2025 (released February 2026).
- Federal Reserve Charge-Off and Delinquency Rates — Quarterly delinquency and charge-off rates at commercial banks. Latest: Q4 2025.
- CFPB 2025 Consumer Credit Card Market Report — Biennial CARD Act report covering market data through 2024. Released December 2025.
- Federal Reserve Profitability of Credit Card Operations — Annual issuer profitability report. Latest: 2025 (covering 2024 data).
- Federal Reserve Survey of Household Economics and Decisionmaking (SHED) — Annual consumer survey. Latest: 2024 data released May 2025.
- Federal Reserve Survey of Consumer Finances (SCF) — Triennial demographic survey. Latest: 2022 data released October 2023. Next release expected late 2026/early 2027 covering 2025 data.
- WalletHub Credit Card Debt Study — Quarterly analysis of Fed and BLS data with inflation adjustments. Latest: April 2026.
- LendingTree Credit Card Debt Statistics — Monthly analysis of 400,000+ anonymized credit reports. Latest: March 2026.
- The Century Foundation / Protect Borrowers report — Analysis of consumer credit data. Released March 2026.
- Experian State of Credit — Annual consumer credit data. Latest: June 2025.
- SuperMoney internal data — Personal loan application and approval data.
Click here to compare credit card offers side-by-side and find the best deal for your situation.
Andrew is the Content Director for SuperMoney, a Certified Financial Planner®, and a Certified Personal Finance Counselor. He loves to geek out on financial data and translate it into actionable insights everyone can understand. His work is often cited by major publications and institutions, such as Forbes, U.S. News, Fox Business, SFGate, Realtor, Deloitte, and Business Insider.
Share this post:
Table of Contents