Understanding the Correlation Coefficient: A Guide for Non-Experts
Summary:
A correlation coefficient is a statistical measure that helps us understand the relationship between two variables. It’s calculated by measuring the linear relationship between the two variables and ranges from -1 to 1. A higher absolute value of the correlation coefficient indicates a stronger relationship between the variables.
Data is an integral part of decision-making, and understanding how to analyze and interpret data is crucial in various fields, from business to scientific research. One of the most commonly used statistical measures in data analysis is the correlation coefficient. While the correlation coefficient can be useful in various contexts, it’s easy to get lost in technical jargon.
In this guide, we’ll break down the concept of correlation coefficient into easy-to-understand language, and provide a step-by-step explanation of how it’s calculated. Whether you’re new to data analysis or looking to refresh your knowledge, this guide will help you better understand the correlation coefficient and its applications.
What is a correlation coefficient?
A correlation coefficient is a statistical measure that shows how closely two variables are related to each other. In other words, it measures the strength and direction of the relationship between two variables. The correlation coefficient ranges from -1 to 1.
- Positive. A score of 1 indicates a perfect positive correlation, which indicates that when one variable increases, the other variable tends to increase as well. For example, there may be a positive correlation between the amount of exercise someone gets and their overall health.
- No correlation. A score of 0 indicates no correlation at all. For a score of exactly 0, you’d likely see a graph with random data points without any kind of recognizable pattern.
- Negative. A score of -1 indicates a perfect negative correlation, which indicates that when one variable increases, the other variable tends to decrease. For example, there may be a negative correlation between the amount of sugar someone consumes and their overall health.
The strength of the correlation is indicated by the absolute value of the correlation coefficient. For example, if the correlation coefficient between two variables is 0.8, this indicates a strong positive correlation, while a coefficient of -0.5 indicates a moderate negative correlation.
How is a correlation coefficient calculated?
A correlation coefficient is calculated using a formula that involves several mathematical steps. The formula is as follows:
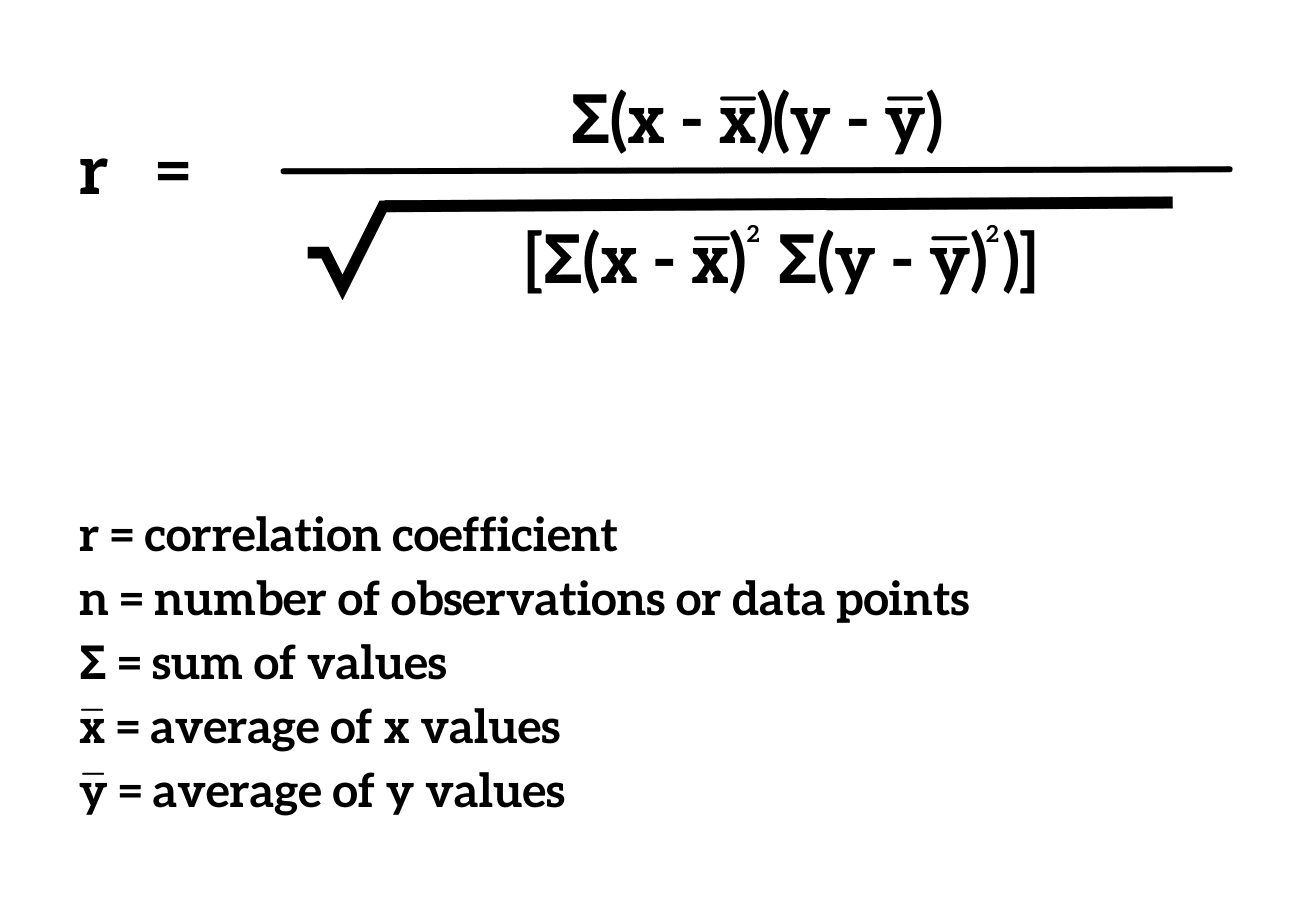
While this formula may seem daunting, it’s actually straightforward when broken down into separate parts. Essentially, the formula calculates the covariance (the measure of how two variables change together) between the two variables and standardizes it by dividing it by the standard deviation of each variable.
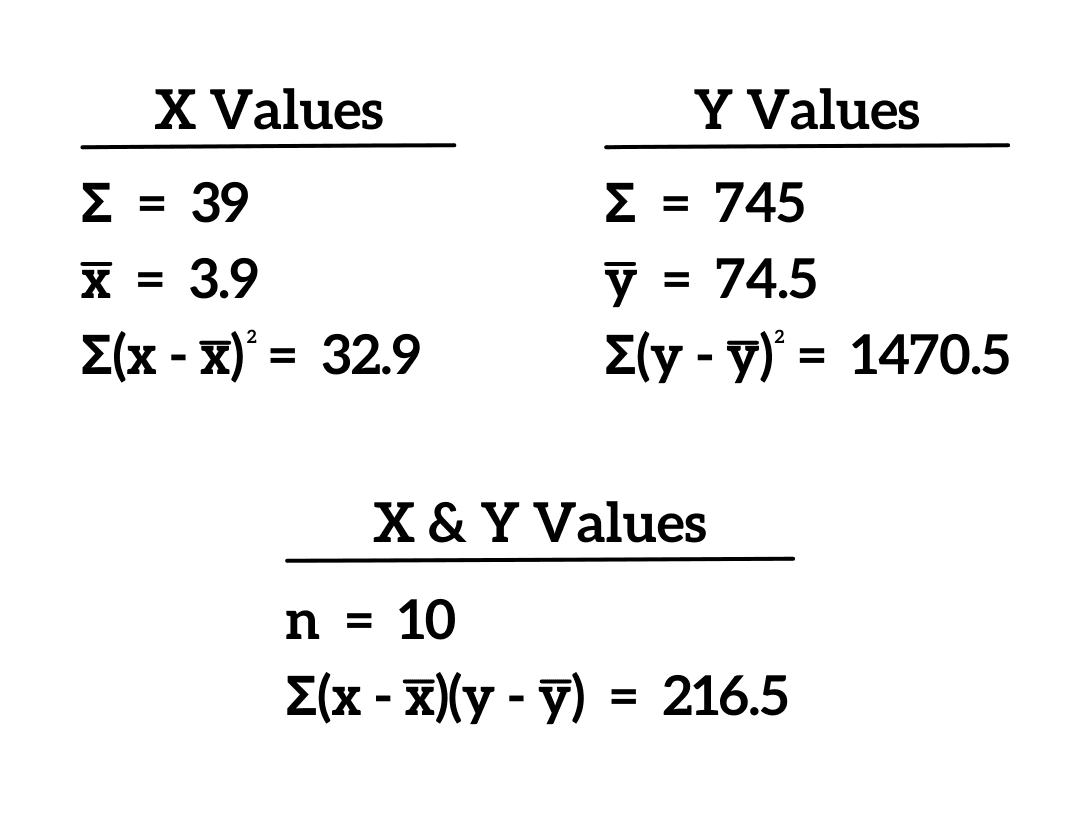
Let’s take an example to illustrate how you can calculate a correlation coefficient. Say we want to calculate the correlation coefficient between the amount of time a person spends studying and their test scores. We gather data from ten students and record the number of hours they studied and their test scores. The data looks like this:
| Hours studied | Test score |
|---|---|
| 2 | 60 |
| 4 | 75 |
| 3 | 68 |
| 5 | 85 |
| 7 | 93 |
| 6 | 85 |
| 1 | 54 |
| 2 | 63 |
| 4 | 78 |
| 5 | 84 |
Using the formula, we can calculate the correlation coefficient:
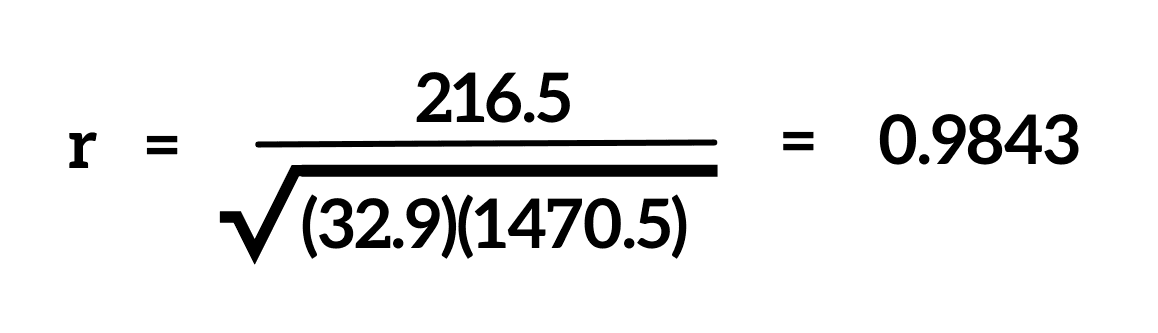
This indicates a strong positive correlation between the amount of time spent studying and test scores.
Why is the correlation coefficient important?
A correlation coefficient is an important statistical measure that can be useful in various contexts.
- Prediction. The correlation coefficient can help predict values for one variable based on the value of another variable. For example, if there is a strong positive correlation between a person’s age and their income, this information may predict the income of someone based on their age.
- Identification of trends. The correlation coefficient can help identify trends and patterns in data. By analyzing the correlation between two variables over time, we can see if there is a trend that indicates a potential cause-and-effect relationship.
- Quality control. Manufacturers can use this calculation in quality control to determine if there is a correlation between two variables, such as the relationship between the size of a product and its weight. This can help ensure that a product meets certain standards.
- Research. A correlation coefficient is frequently used in scientific research to analyze data and identify patterns. By understanding the correlation between variables, researchers can gain insights into potential relationships and causal effects.
- Business. Business employees and owners may use this calculation in many business fields, from finance to marketing. For example, a company may use a correlation coefficient to analyze the relationship between marketing spend and sales. On the other hand, they may use this calculation to understand how different factors, such as pricing or promotions, may affect customer behavior.
What are the limitations of this number?
While the correlation coefficient can be a useful statistical measure, it’s important to be aware of its limitations. Here are a few things to keep in mind when working with correlation coefficient:
- Causation vs. correlation. The correlation coefficient can indicate the strength of a relationship between two variables, but it cannot prove causation. Just because two variables are strongly correlated does not necessarily mean that one causes the other. There may be other underlying factors that affect both variables.
- Outliers. This calculation is sensitive to outliers, which are data points that are significantly different from the rest of the data. A single outlier can greatly affect the value of the correlation coefficient, making it appear stronger or weaker than it actually is.
- Nonlinear relationships. The correlation coefficient measures the linear relationship between two variables, but it cannot detect nonlinear relationships. For example, two variables may be strongly related in a quadratic or exponential way, but the calculation wouldn’t be able to capture this relationship.
- Small sample sizes. The correlation coefficient may not be reliable for small sample sizes, as a random variation may skew the results. The larger the sample size, the more reliable this calculation is likely to be.
- Limited scope. The correlation coefficient only measures the relationship between two variables, and cannot take into account the effects of other variables. For example, in a study of the relationship between smoking and lung cancer, the correlation coefficient may be high. However, this relationship may be influenced by other variables such as genetics or environmental factors.
By keeping these limitations and uses in mind, you can effectively calculate and understand what a correlation coefficient may be highlighting in a data set.
Key Takeaways
- A correlation coefficient is a statistical measure that indicates the strength and direction of the linear relationship between two variables.
- This value can range from -1 to 1, with higher absolute values indicating a stronger relationship between the variables.
- While the correlation coefficient can be useful in various contexts, you should also be aware of the calculation’s limitations.
- Make sure to use a correlation coefficient in conjunction with other statistical measures to make better decisions and gain deeper insights into the data.
Table of Contents