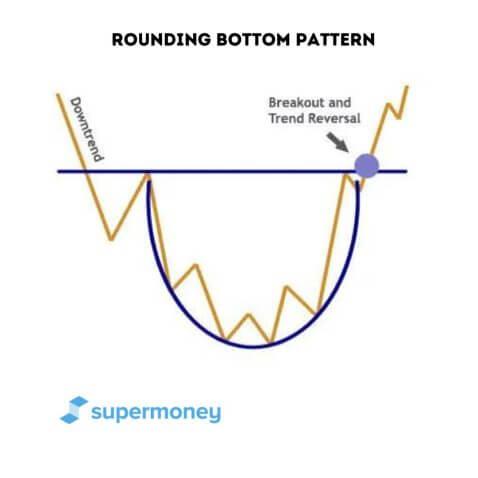
Rounding Bottom Pattern
Summary:
The rounding bottom chart pattern is a reversal pattern that forms after a downtrend or bear market. The pattern consists of a gradual downward trend, followed by a bottom, and then a gradual trend upward, forming a U-shape. The pattern indicates that there is a reversal taking place and that the asset price will reverse to a bullish trend.
In trading, all buyers have a goal in mind. That goal is to buy at the absolute best price possible, which will, in most cases, be the bottom of the market. The trick for traders who want the best value possible is to determine where the bottom is. If they move too soon and the price continues to drop, they can stand to lose a fair amount of money and will never hit their profit target. For this reason, traders will use chart patterns, along with various other forms of technical analysis, to dictate entry points into the market. One of the most popular patterns to use for buyers who want to find the best price at a possible market bottom is the rounding bottom chart pattern.
What is a candlestick pattern?
A candlestick pattern is a graphic representation of changes in price on a candlestick chart that some traders believe can predict future price movements. Bullish patterns predict increases in price, while bearish patterns indicate that the price may drop. Check out our in-depth article about how to read these charts and some other common patterns.
What is the rounding bottom chart pattern?
A rounding bottom is a reversal pattern that indicates the price is hitting a bottom, and there will be a reversal in the market, from a downtrend to an uptrend. The pattern forms at the bottom of a bearish trend, where the downward-trend price action begins to lose momentum before gaining it again in the opposite direction. First, the price will continue to descend before rounding out, hitting bottom, and rounding up. The price will subsequently begin to edge up, signaling that there is preparation for a market reversal. The pattern forms a U-shape, with a descent, bottom, and uptrend resembling the contours of the letter U. The rounding bottom pattern can also look similar to the cup and handle pattern, without the temporary downward trend of the cup and handle’s “handle” portion.
A truly viable rounding bottom pattern is one of the rarer chart patterns you’ll find. It is a reversal pattern that comes off the back of a downtrend. So it’s crucial that traders are able to identify and verify the pattern as best they can to hedge against the downtrend just continuing its descent. Volume is one of the keys that traders will use when analyzing a rounding bottom in a bear market. The pattern signifies a loss of momentum for the sellers as they hit the low point and the momentum starts to shift to the buyers. They now have the power, and there is a gradual price shift.
What constitutes a rounding bottom pattern?
A rounding bottom will most often occur at the bottom of a long downtrend. The trend can take a longer time to form than most, and it will be made up of the following elements.
Consolidation
Consolidation occurs when the market is trading within a range. It’s generally attributed to market indecisiveness, in which there are no clearly defined breakout trends yet.
Downward trend leveling out toward the bottom
A rounding bottom is preceded by a bear run or downtrend in the market. The prior trend begins to level off and curves rather than spiking down. The pressure from the sellers is not as great, which allows the price to hit bottom.
Low point (bottom)
Just like a U has a point that you can put smack dab in the center of it, so does a bottom in a rounding bottom chart. This is the point that the price action descends to before beginning to turn upwards.
Upward trend gathering momentum
After the asset price hits bottom in the U-shape, it begins to start trending upward. It starts to gain momentum as the price ascends.
Breakout to the upside
Once the pattern breaks out, the pattern is complete, and there should be a significant break to the upside. As this pattern occurs during a long downtrend, this can often be considered the market hitting bottom after a long bearish bias.
Real-life example: S&P 500
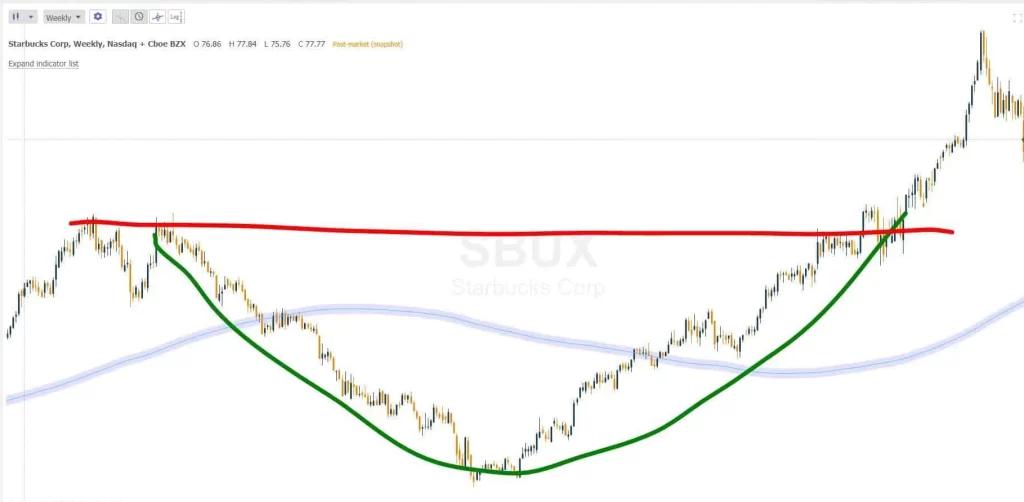
The financial crisis of 2008 resulted in a downtrend of the market, followed by a “bottoming” of the S&P 500 in March of 2009. The graph above deals with Starbucks Corp. but is similar to many publicly traded stocks during this period of time. Here you can see the rounding bottom pattern form over a longer period of time.
There is a long-term descent of the asset price at the beginning of January 2007. This pattern forms over a very long duration, but the bottom point is in and around March 2009, when the S&P 500 hit its bottom. The pattern slowly gains momentum on the upswing and then breaks out around September 2011.
What happens during the round to the bottom?
Trading at its most fundamental level is a battle between buyers and sellers, using supply-and-demand metrics to define who is winning. The price was previously on a continued descent in which the sellers had all of the momentum, and people were piling into short positions. When the pattern starts to curve and level off, this is usually an indicator of too much supply coming to the market in short positions. Before, when the market was in its downtrend, short positions were being snapped up. Now, there is an excess supply of short positions, which is causing the momentum from the sellers to weaken and slowly level off to the bottom.
What happens at the bottom of the U?
Think of the bottom of the U as a meeting point between the buyers and sellers. It’s a resting point that is accompanied by a listless period in volume. Once these buyers and sellers meet at the low point, the momentum slowly begins to shift to other buyers. This is where both buy stops and stop losses by the sellers will accumulate, at the bottom of the U.
What happens when it rounds up?
The sellers have been pushing the price down but have been losing steam and momentum until they hit bottom. Once there, the bulls jump in at higher price points and don’t let the price drop to its previous support levels. This usually coincides with an increase in volume as the price begins to rally. The bulls have now turned the table, and as they break through the pattern on the upward part of the U, they have the momentum.
Sometimes when you first start out, it’s hard to determine what really makes a curve round one direction or another. The best way to confirm that a pattern is what you suspect it to be is to practice. Here are some brokerages that can get you started.
Volume and time frame
The volume of trading works as follows. There will be increased volume as the price descends into a rounding bottom. The volume begins to level off until it hits the low point. Once the price begins to increase and trend up, momentum gathers, and volume increases. The strongest volume will be felt near the breakout point. The volume of the trade mirrors the trajectory of the asset price. Volume levels off on the descent until it reaches its lowest point at the bottom and then begins to increase again, just as the price also increases. Volume and price action should work more or less in tandem with the rounding bottom pattern. The lower the level of support on the pattern, the lower the volume will be.
Rounding bottom patterns typically take a while to complete and should be verified with that in mind. Regardless of the general time frame (weeks, months, etc.), this pattern doesn’t form instantly, and both curvatures need to be confirmed. This is important to remember because, as rounding bottoms are a rarer breed and signify a big trend reversal, they can be misidentified quite a bit.
Pro Tip
When looking at the volume of the trade in a rounding bottom pattern, although it is technically supposed to mirror the U-shape, it’s not always perfect. There might be spikes and drops in volume that don’t mirror the U exactly. However, as long as the volume is generally working along the outlines of the pattern, traders should be able to verify it as a rounding bottom pattern.
Rounding bottom trading philosophy
Let’s review how traders would respond to a rounding bottom pattern.
When to open a trade
Rounding bottoms symbolize the bottom of a long downtrend, so traders looking to open up a long position on the asset have a couple of ways to trade it. As the pattern signifies a major reversal, most traders will opt for opening up a long position after the break. More aggressive traders will open up a position close to the neckline where the asset price breaks out. The idea for them is that the momentum will continue, and there shouldn’t be a further downswing toward the support level. A more conservative trader might wait for the price to break, followed by a pullback and retest, before they decide to enter.
How to manage the downside
A more aggressive trader will put a stop loss at the bottom of the pattern, otherwise known as the lowest low of the pattern. This enables them to protect themselves while allowing for some room to maneuver should the price go lower than expected. A more conservative trader might put the stop loss at the bottom of the candle that broke out from the pattern. Obviously, this preference is up to the trader and is usually combined with other forms of technical analysis that made them interested in the asset in the first place.
Retirement is another pattern you should care about, but you won’t see it on a chart. The pattern is a daily, monthly, or yearly pattern of saving for your retirement. No matter when you start, good habits and regular patterns of contributing to your retirement can let you rest assured you are covered. Here are some advisors that can help.
FAQ
How accurate is the rounding bottom pattern?
A rounding bottom pattern is considered to be fairly accurate. However, it can take some time to form and thus needs to be confirmed before a trade is opened.
Is a rounding top bullish or bearish?
A rounding top is generally a bearish pattern — when the pattern shape breaks, the price trades progressively lower. A rounding top is a reversal chart pattern that follows an uptrend in the market, indicating that the market may now switch.
What is a rounding top and bottom?
Rounding top and bottom chart patterns are used to explain either the bottom or top of a market in which a reversal is about to take place. It signals a shift in momentum from the trend that preceded it to the opposite trend. If it’s a rounding top, it will be a reversal from an uptrend to a downtrend; a rounding bottom represents a reversal from a downtrend to an uptrend.
Is the double-bottom pattern bullish?
Yes, the double pattern resembles a W, and it does indeed indicate a bullish bias.
What is a double-bottom pattern in crypto?
A double bottom pattern in crypto signals that the cryptocurrency is going through a consolidation period before it breaks to the upside. It is more often than not preceded by a downtrend in the market.
Is a triple-bottom bullish or bearish?
A triple bottom is bullish. A rounding bottom, a triple bottom, and a double bottom (W) pattern all indicate bullish biases.
What is the 3-day rule in stocks?
The 3-day rule is governed and implemented by the U.S. Securities and Exchange Commission. Also known as T+3, it stipulates that the brokerage must receive your payment no later than three business days after the trade was executed.
Key takeaways
- The rounding bottom chart pattern is a reversal pattern that forms after a downtrend or bear market. The pattern consists of a gradual trend downward, followed by a bottom, and then a gradual trend upward, forming a U-shape.
- The pattern signifies a gradual price shift, in which a decline turns into an incline in price after meeting at the low point. It signifies a shift from a bear market into a bull market.
- Volume should mirror the formation of the pattern, in which it is high on the descent, but slowly declines until it hits bottom. The volume will then gradually rise in tandem with the price and increase on a breakout.
- As rounding bottoms are typically seen after a prolonged bear run or downtrend, they signify a big reversal. Confirmation of the pattern is of utmost importance.
Table of Contents