Head and Shoulders Pattern
Summary:
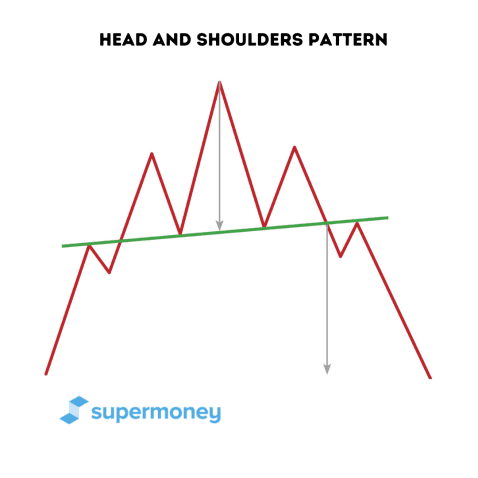
A head and shoulders pattern looks like it sounds. It consists of three peaks and two troughs. The troughs stay at roughly the same level of support that forms the neckline. The first and third peaks are at roughly the same level of resistance, with the second peak touching a higher high than the first and third. The pattern usually indicates bearish bias and typically indicates the reversal of an uptrend to a downtrend.
The ability to spot patterns in the stock market is one of the qualities that can help a novice trader start to grasp market behavior. When looking at how to invest (yourself and via a brokerage), a trader can employ many forms of technical analysis. These will inform you of both the intrinsic value of the asset and the economic indications that the value of the asset might move in an upward or downward trend.
Once you complete that analysis, you will want to find places in the market to open up trades that will take advantage of your overall trading thesis. This is when the head and shoulders pattern can come in. If you think an asset is overvalued or that there will generally be a downtrend in the market, then the head and shoulders pattern can show you where to get in with a bearish outlook.
What is a candlestick pattern?
A candlestick pattern is a graphic representation of changes in price on a candlestick chart that some traders believe can predict future price movements. Bullish patterns predict increases in price, while bearish patterns indicate that the price may drop. Check out our in-depth article about how to read these charts and some other common patterns.
What is a head and shoulders pattern?
A head and shoulders technical chart pattern consists of three peaks and two troughs. It is the direct opposite of an inverse head and shoulders pattern. The support line (neckline or head and shoulders bottom) stays relatively the same — the troughs are roughly equal at the bottom points before they begin to trend upward. The three peaks work as follows: The first peak (left shoulder) and third peak (right shoulder) are roughly the same heights, hitting similar points on the top resistance level. The second peak (the head) is higher than both the first and third peaks.
The trend typically indicates a reversal pattern in which the market will now turn from bullish to bearish. Many times, a head and shoulders pattern is a strong indicator of a bearish reversal. As the pattern completes, the sellers have the power and will try to make a significant push toward the end of the pattern, to facilitate a break to the downside.
What makes up a head and shoulders pattern
Unlike the inverse head and shoulders pattern, a traditional head and shoulders pattern will most likely indicate a bearish bias or a bearish trend. This indicates that sellers should move in, anticipating a significant turn to the downside. Here is what makes up a head and shoulders pattern.
Consolidation
Consolidation occurs when the market is trading within a range. It’s generally attributed to market indecisiveness, in which there are no clearly defined breakout trends.
Three different peaks at the top level of resistance
The pattern consists of three consecutive peaks that touch the resistance line at different points. The pattern will hit the first peak before being pushed down by the sellers. The sellers will give up even more territory on peak two, which will be higher than peak one. The buyers will not be able to push as high on the third peak, and the resistance level will be similar to that of the third peak.
Two similar troughs
The pattern will consist of two low points, or troughs, at generally the same point. It’s important to note here that the two troughs do not have to hit the exact same resistance point. The second trough needs to hit the general area of the second trough to be considered a viable pattern.
Pro Tip
Many times, the underlying support line that the two troughs hit will not be a straight line. In most cases, it will be on a sort of slope rather than a 180-degree line. This is an important quality to note when trying to spot the pattern. Think of it as a human body leaning one way or another — the head and shoulders of the body will now be on a slope.
Multiple points hit
A head and shoulders pattern needs to hit five points to be considered a viable pattern. There should be three peaks: points one, three, and five. These should run lower, higher, and lower. The second and fourth points will be two troughs, and those are at roughly the same level of support, although there can be some variance.
Breakout to the downside and reversal
The head and shoulders pattern is most commonly considered a reversal pattern that indicates a market change from bullish to bearish. Many times, it will occur toward the top of a bull market, indicating that the trend is going to reverse. At the end of the pattern, there should be a significant break to the downside.
Real-life example: British pound
This graph represents a head and shoulders pattern that becomes apparent over a few months when looking at the value of the British pound. As mentioned previously, the neckline is not a straight 180-degree line and slopes slightly up.
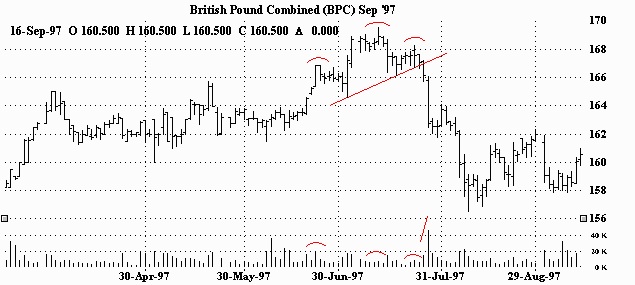
The pattern takes place more or less after a few months of a general uptrend. As the pattern consolidates, the volume of the trade actively levels off. However, in and around the breaking point, you can see the volume increase significantly. The buyers were not able to achieve a price close to the head on the second shoulder, and thus the sellers now have the power. The price breaks to the downside, and volume significantly increases as the sellers pile in.
If you are reading this and are interested but still don’t understand exactly how this type of trading works, the best way to improve is to practice in real-time. Here are some brokerages that cab help you get started on your pattern-trading journey.
Why are the peaks unequal?
One of the most significant qualities of the head and shoulders pattern is the consistency of the unequal peaks. The first peak hits a point at resistance, followed by a higher peak, and then back to a similar level that the first peak hit. The tricky part is that in a bull market, it can look like a continuation of an uptrend until the second shoulder is formed. The buyers are making a push on the first peak, followed by a further push that results in more success when they hit the second peak. However, on the third peak (or right shoulder), rather than waiting to sell at the point of the second peak, the sellers come in early before the price falls again. This indicates a reversal of momentum, which is now on the side of the sellers.
Why are the troughs roughly equal?
The troughs are equal because the buyers are holding support at that level. The second trough acts as a confirmation line in which the pattern can now go one way or another. Either the bulls make a significant push and hit a peak as high or higher than the second peak, or they don’t. However, bulls have been holding support around that level of the second trough. Suppose they aren’t able to push as high or higher on the third peak and instead hit a level that is similar to the first peak. In that case, it represents a shift in momentum. Even though the bulls have held the support line, their inability to push higher indicates that the power is now with the bears. The bulls won’t be able to hold that trough line much longer. Instead, the bears will make a significant push to the downside, and the pattern should break down.
Volume and time frame
Head and shoulders patterns work similarly to other chart patterns in which volume significantly decreases as the pattern takes shape. Once the price starts to break the pattern, the volume will increase — in this case, on behalf of the sellers pushing the price down. In terms of market dynamics, trend reversals will have strong trends leading up to them. Here, it would be an uptrend.
In terms of time frame, one trick some traders use is to note that the uptrend heading into the pattern should be twice as long as the distance between the two shoulders. This will increase the chances that any reversal trend will be significant enough to take action on and open a trade.
Trading can be fun and enlightening but sometimes risky if you are a novice. It’s best to have some stable investments that you aren’t actively trading to back up your retirement plans. Here are some advisors that can get you started.
How would you open a trade?
As with most patterns, according to many traders, the true breakout point is the ideal place to place a short trade. More aggressive traders might recommend putting a short right before the second trough if they are really confident that the market will reverse, based on other technical analyses. A more common approach would be to open a trade once the pattern has broken out, near the breaking point. This is when the price closes below the confirmation line that was offering support. Some more conservative traders will always recommend waiting for a possible pullback before opening a position.
How would a trader manage the downside?
Depending on the trader, a more aggressive trader might put a buy stop near the top of the head (second peak). This will allow some leeway if the second peak is slightly higher than the first peak, but the pattern is still viable. A more conservative trader might put a buy stop at the top of the second peak. The trader might combine this with other forms of technical analysis to make a definitive move.
FAQ
What does a head and shoulders pattern tell you?
A head and shoulders chart pattern typically indicates a reversal trend in which the sellers have now gained momentum, and there should be a break to the downside. The pattern insinuates that the buyers made a push and then gained momentum on a second push with the second peak (head). But on the third peak, the sellers jumped in early and did not let the price reach the previous peak. This means after the third peak forms below the second peak, the sellers have the momentum and will make a push below the support line.
Is a head and shoulders pattern good?
That depends on your trading thesis. Should you feel the asset is overvalued and should trend down, then this pattern can explain when you might jump in to take advantage of a downtrend.
How do you play the head and shoulders pattern?
Many traders will open a trade either before, at, or after the breaking point at the retest levels, depending on their risk preferences. In terms of profit targets, although there are strategies, it depends on the individual trader to assess if they are day trading, swing trading, or long-term trading. This will help establish when they will take profits in a head and shoulders target. The trading philosophy of the trader determines the profit target.
Is a head and shoulders pattern bearish?
Yes, a head and shoulders pattern usually indicates a bearish reversal.
Which time frame is best for the head and shoulders pattern?
There is no exact set time frame for the pattern to form. Traders will look at hours, days, weeks, and even months. However, many traders will want to see that the uptrend that preceded it is twice as long as the distance between the two shoulders.
Key takeaways
- A head and shoulders pattern consists of three peaks and two troughs. The two troughs’ low points will be at similar points at the support line. The first and third peaks are at similar levels of resistance, forming the shoulders, and the second peak is significantly higher, forming the head.
- The head and shoulders pattern is typically a reversal pattern, indicating a move to a downtrend after an uptrend.
- A head and shoulders pattern represents the buyers losing momentum at the right shoulder and the sellers then gaining momentum.
- As with most patterns, there will be less volume during the consolidation phase of the pattern, followed by increased volume as the asset price begins to break out of the pattern.
Table of Contents