
You Need $110K a Year to Buy a Home Now. Two-Thirds of the Problem Comes Down to One Number

Last updated 08/10/2026 by
SuperMoney Team
Edited by
Andrew Latham
Summary:
It takes $109,796 a year to afford the typical American home, and that number has barely moved in three years. Roughly two-thirds of the problem is the interest rate, not the house: at 2021’s 3% rates, today’s typical home would only require about $80,000 of income. The fix is not just lowering rates (more on why below).
The typical American home now requires $109,796 in annual income to buy, according to Redfin’s June 2026 data. The median household earns $87,599. That’s a $22,197 gap, and it’s the third year running that headline has hovered near $110,000.
Stuck numbers make for boring headlines, so most coverage moves on. That’s a mistake. The interesting story isn’t that the number is frozen. It’s why it’s frozen, what’s quietly changing underneath it, and what you can do while everyone else waits for a rescue that isn’t coming.
Compare Home Loans
Compare rates from multiple vetted lenders. Discover your lowest eligible rate.
Two-thirds of the “affordability problem” is a rates issue
When people hear “housing affordability crisis,” they picture greedy sellers and bidding wars. But home prices rose only about 2% over the past year. What’s holding the required income near $110,000 is the cost of borrowing.
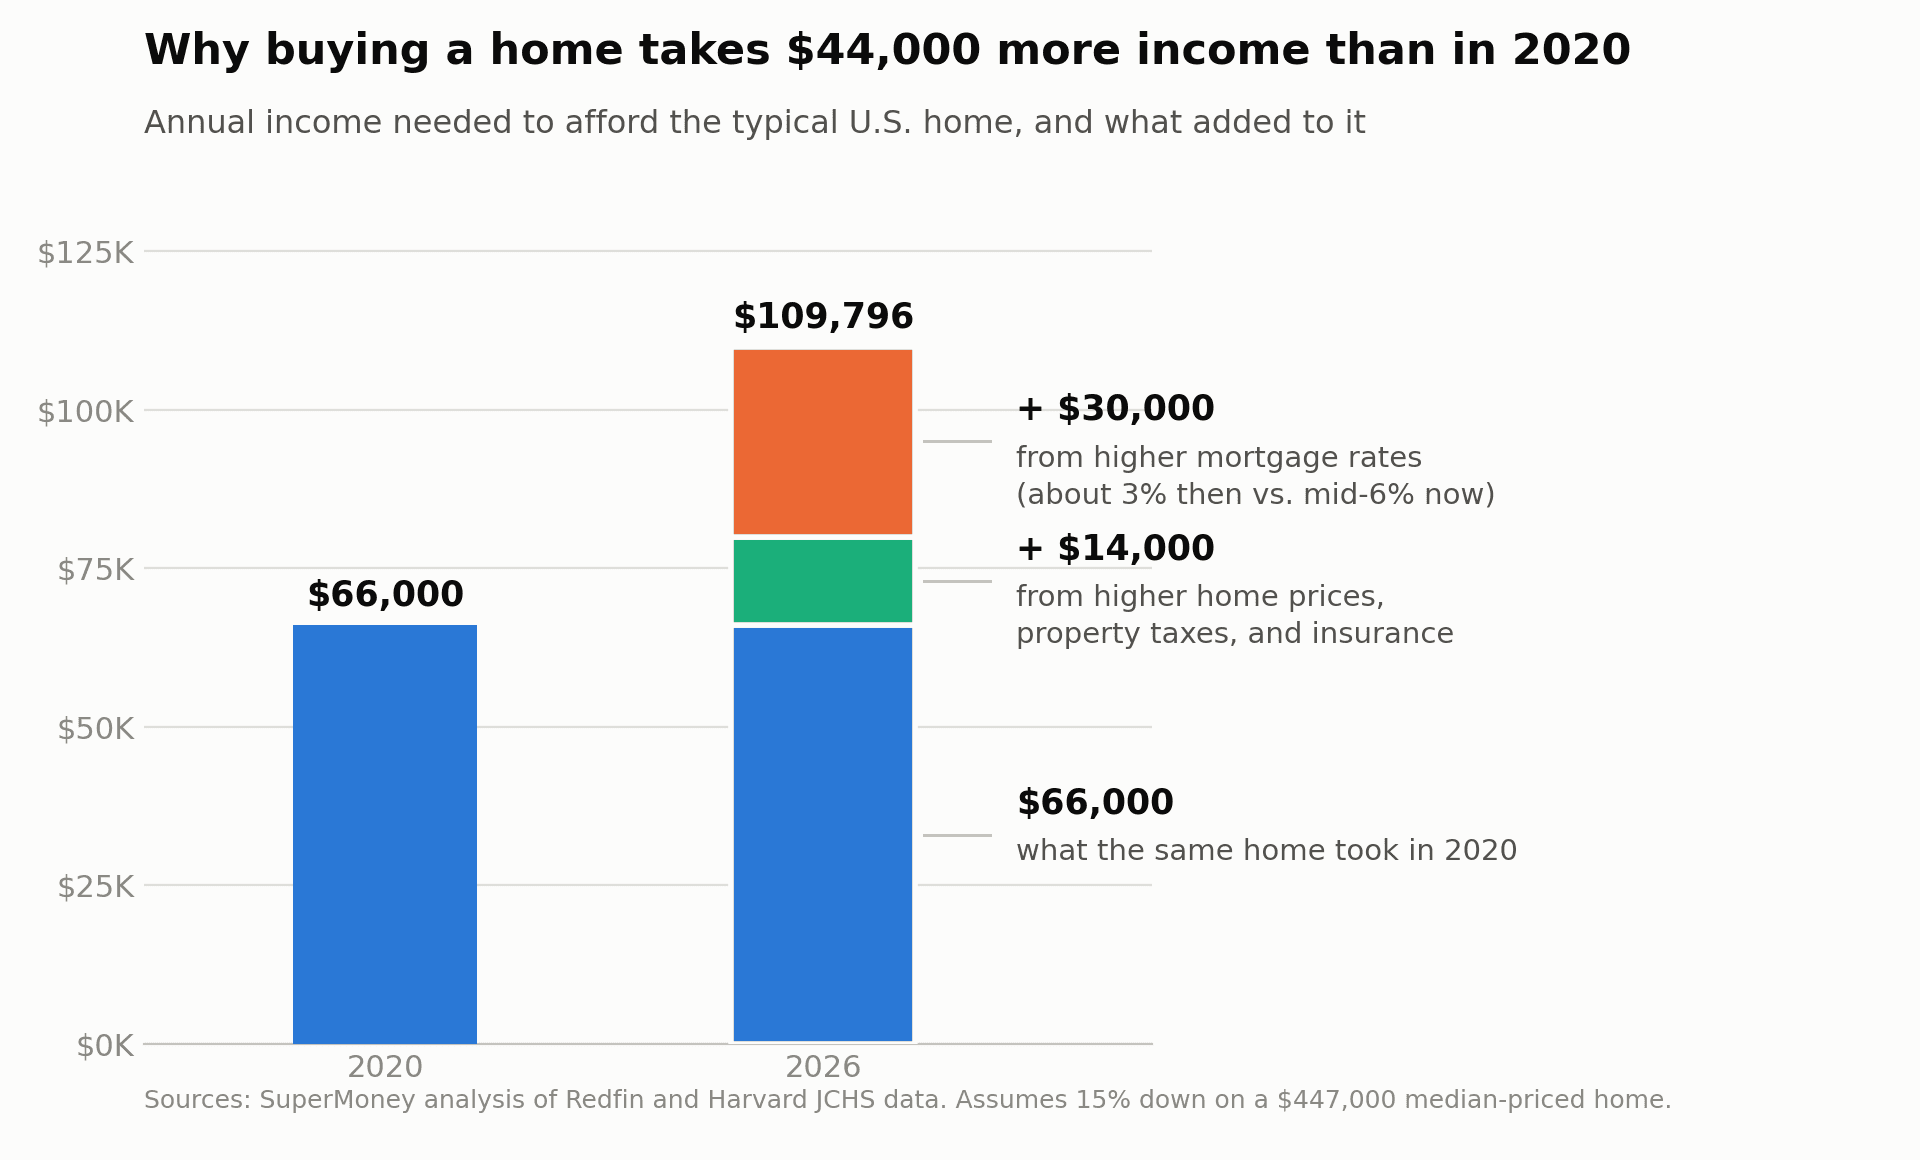
Here’s the math that proves it. Run the numbers on today’s median-priced home (around $447,000, 15% down) at 2021’s 3% mortgage rates instead of today’s mid-6% rates. The income needed to buy it falls from $110,000 to about $80,000. With the median household earning $87,599, that home would be affordable to the typical family right now. Same house, same price. The entire affordability gap for the typical family is the interest rate, not the house.
Break down the $44,000 jump in required income since 2020, and the split is lopsided: roughly $30,000 of it is the rate. Only about $14,000 is price appreciation. Rates are about two-thirds of the problem.
As a rule of thumb, every full percentage point that mortgage rates fall cuts the required income by roughly $10,000 a year. That’s about the same relief you’d get from a 10% drop in home prices. This distinction matters for your strategy. If the problem were prices, waiting might work. Because the problem is the payment, the smart moves attack the rate. More on that below.
Why prices won’t drop: the market is frozen, not balanced
Here’s the part that trips people up. Existing home sales are running near 30-year lows, about 4 million a year, down from 6.1 million in 2021. Demand has cratered. And prices still went up.
That only happens when sellers are as scarce as buyers. Most homeowners are sitting on mortgage rates far below today’s mid-6% market. Selling means voluntarily doubling their own housing payment, so they don’t. Inventory stays tight, and prices stay propped up even with demand this weak.
If you’re waiting for a flood of desperate sellers to crash prices, understand who you’re betting against: homeowners with 3% mortgages and record equity who have every reason to stay put.
How we got here: a generation of affordability erosion in six years
In early 2020, a household earning about $66,000 could afford the typical American home. The monthly payment on a median-priced home was roughly $1,700. Today that payment is about $3,100, and the income requirement is $110,000. Required income jumped about two-thirds in six years while median household income grew about 30%.
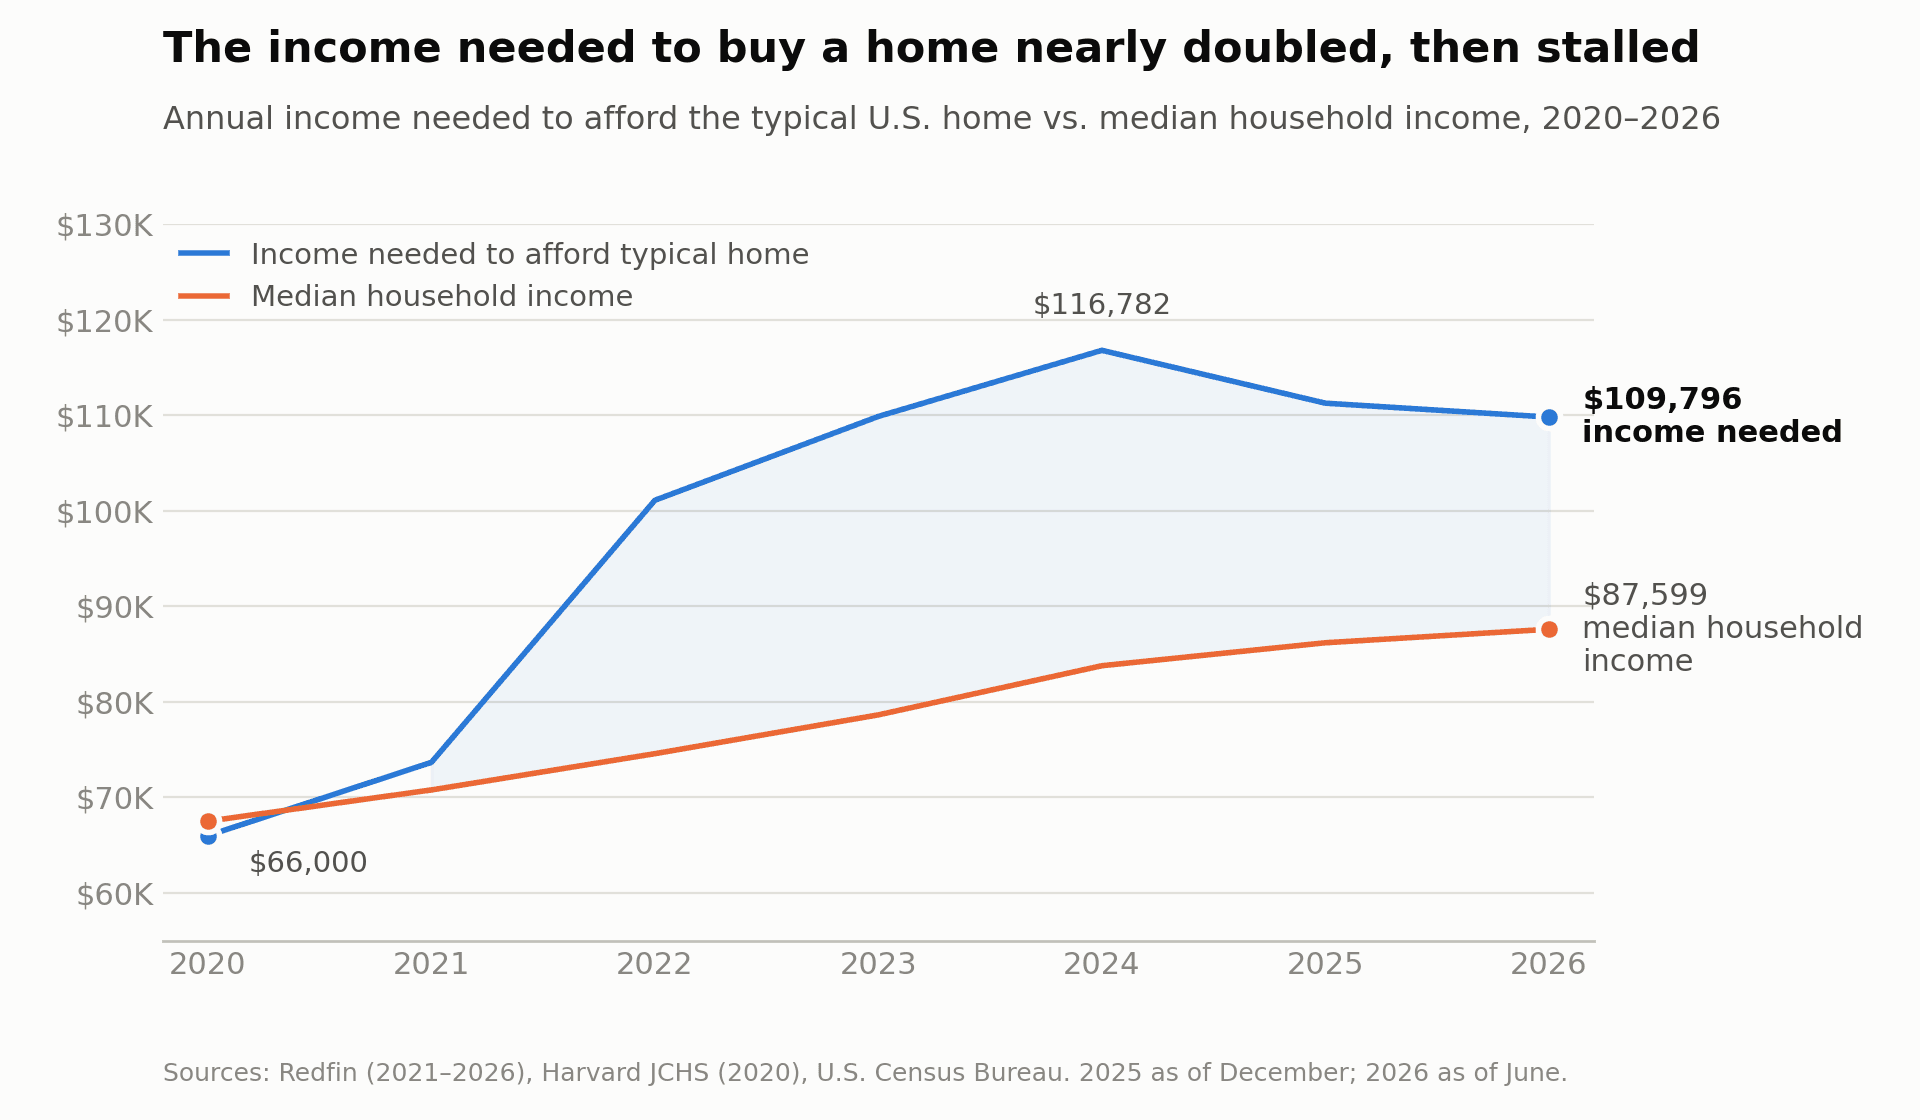
Look at the left edge of that chart. In 2020, the two lines touched. The median earner could afford the median home. That wasn’t some golden age of cheap housing, either. It was six years ago. We compressed a generation’s worth of affordability erosion into half a decade, and the chart shows exactly when it happened: 2022, the year rates doubled.
The 30% rule is now aspirational
For decades, lenders and financial planners have used the same benchmark: keep housing at or below 30% of your gross income. The typical buyer today commits 37.6% of their income to housing.
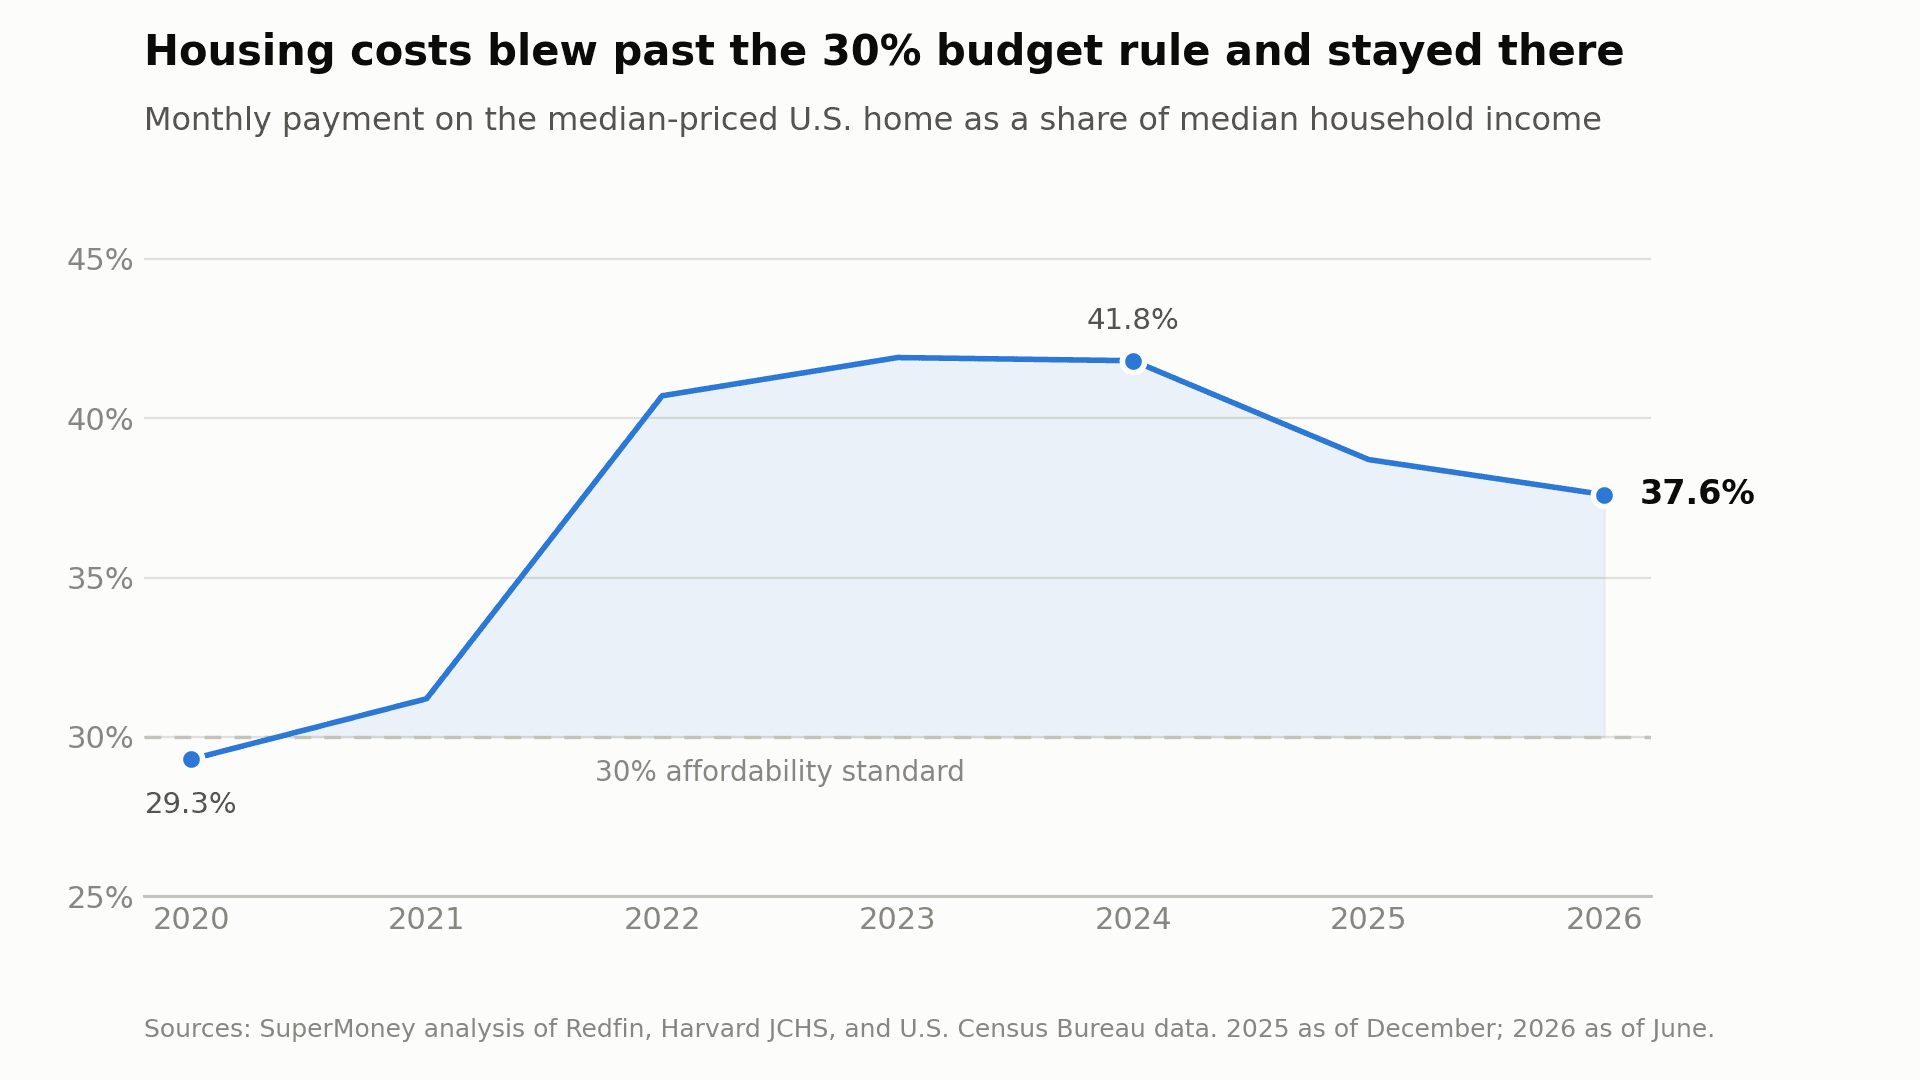
We’ve quietly redefined “affordable” upward. However, the trend is improving. That share peaked near 42% in 2023 and 2024 and has fallen for two straight years. Only about a third of listings (34.2%) are within reach of a median earner, but even that’s improved from 30.5% a year ago.
As with most things in real estate, location is a huge factor in housing affordability. Exactly three major metros remain where the median household can afford the median home: St. Louis, Indianapolis, and Pittsburgh. San Francisco, at the other extreme, requires $453,205 of income. That’s less an affordability crisis than a mismatch crisis. The jobs, and increasingly the people, aren’t where the affordable homes are.
The quiet good news nobody is covering
Affordability is actually healing. Just not the way people expect.
The gap between the income you need and the income the typical household earns has narrowed three years running: from $28,834 to $26,125 to $22,197. Prices aren’t falling. Paychecks are catching up, growing about 4% a year against housing costs growing about 2%.
Before you cheer for a faster fix, remember what the fast fix looks like. The last time affordability reset through falling prices was 2008 to 2012, and it came packaged with mass foreclosures and 10% unemployment. The healthy version is the boring one: flat-ish prices while incomes grow. That’s the 1980s playbook. After mortgage rates hit 18% in 1981, prices never crashed nationally. Time and income growth did the work.
The catch is the timeline. At the current pace, it would take roughly a decade for the typical buyer’s burden to fall from 37.6% back to the 30% standard. It’s getting better, but it will take years to really make a dent. Anyone expecting 2020 affordability to return anytime soon is going to be disappointed.
What you can actually do about it
You can’t negotiate the median home price. You can negotiate your rate. Three moves worth your time:
- Ask for a seller-paid rate buydown instead of a price cut. In a slow market, sellers will often fund one, and a buydown cuts your payment far more per dollar than the equivalent price reduction.
- Shop at least five lenders. Rate spreads between lenders on the same borrower routinely run half a point or more, and on a $380,000 loan, half a point is worth roughly $1,500 a year.
- The most underused trick in the market: ask whether the seller’s existing FHA or VA loan is assumable. Millions of low-rate loans from the 2020 and 2021 era are out there, and assuming one can hand you a rate nobody can buy today. Most buyers never ask.
Should you wait for rates to fall?
If rates are two-thirds of the problem, cutting them to 3% sounds like the obvious fix. It isn’t. Cheap money is why prices jumped around 40% between 2020 and 2022 in the first place. A sudden return to it would bring millions of sidelined buyers off the bench faster than it coaxes sellers back, and bidding wars would claw much of that $30,000 of rate relief right back through prices.
On paper, rates are the villain. In practice, the market math says gradual rate declines, with time for inventory to rebuild, are the only version of “lower rates” that actually stays affordable. So the dream scenario, a fast plunge back to 3%, would probably help you less than you think.
Key takeaways
- Buying the typical U.S. home takes $109,796 in annual income; the median household earns $87,599.
- The affordability gap has narrowed three straight years, from $28,834 to $26,125 to $22,197, driven by wage growth rather than falling prices.
- The typical buyer spends 37.6% of income on housing, versus the long-standing 30% standard. At current trends, closing that gap takes about a decade.
- Of the $44,000 jump in required income since 2020, roughly $30,000 comes from higher mortgage rates and only $14,000 from price appreciation. At 2021’s 3% rates, today’s typical home would require about $80,000 of income.
- Only three major metros remain affordable to a median earner: St. Louis, Indianapolis, and Pittsburgh.
- Rental vacancy has risen from 5.9% in 2022 to 7.3%, an early sign of the supply slack that precedes real affordability relief.
Share this post:
Add as a preferred source on Google
Table of Contents