Ascending Triangle Pattern
Summary:
An ascending triangle is a trading pattern in which there is a flat level of resistance at the top and progressively higher low points or support levels at the bottom. An ascending triangle pattern usually infers a bullish outlook on the asset that results in accumulation. The trading thesis is that once the price of the asset breaks through the pattern, there should be a long-term continuation trend. An ascending triangle usually indicates that buyers of the asset have a stronger hand than sellers.
In the world of trading, traders need to focus on two important concepts. The first is the actual value, based on technical analysis of the asset and general macro trends related to the asset they are trading. The second is the general behavior of other traders in the marketplace. Just like in any marketplace, traders will typically behave in a similar fashion. This will result in patterns of trading that become clear when you look at the historical trends of the asset’s price movement. One of the most common patterns you find in trading is the ascending triangle, which we explain further below.
What is a candlestick pattern?
A candlestick pattern is a graphic representation of changes in price on a candlestick chart that some traders believe can predict future price movements. Bullish patterns predict increases in price, while bearish patterns indicate that the price may drop. Check out our in-depth article about how to read these charts and some other common patterns.
What is an ascending triangle pattern?
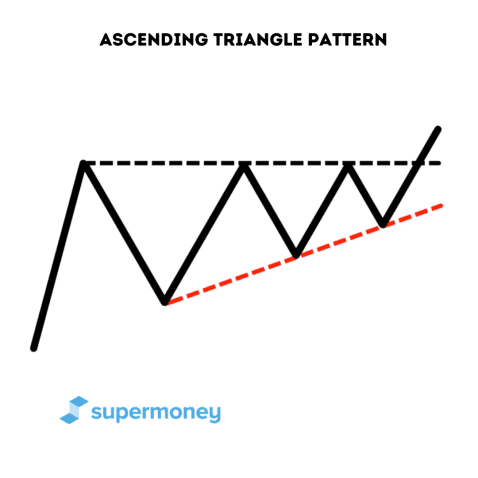
An ascending triangle pattern is one variation of a triangle chart pattern. The ascending triangle is a continuation pattern defined by a flat horizontal level of resistance at the top of the trade, and price bottoms (or support levels) that become progressively higher. To put it simply, the top line is flat, and the bottom line is an ascending slope, forming a triangle. Eventually, these two lines will converge, and this is when the asset might be able to break through the triangle shape and continue on a longer-term trend upwards. Once the pattern completes, there could be a significant upside breakout.
This pattern’s horizontal line of resistance and progressively higher bottoms emerge because of certain behaviors by other traders in the market who are buying and selling. The accumulation of these behaviors creates the ascending triangle pattern, which in turn indicates to the trader that the price of the asset might break out of the pattern and trend further upward. An ascending triangle in an uptrend indicates that buyers of the asset are in an advantageous position.
Looking for someone to advise you on assets that are about to reach their breakthrough points? Here are some advisers that can help you.
What makes up an ascending triangle pattern?
 As opposed to a descending triangle or symmetrical triangle, an ascending triangle will typically have a bullish trading bias. However, ascending triangles can occur in any type of market. Below is an example of what this pattern looks like and the elements that cause it to be a viable pattern.
Consolidation
Consolidation occurs when the market is trading within a range. It’s generally attributed to market indecisiveness, in which there are no clearly defined breakout trends as of yet.
Horizontal level of resistance at the top
The ascending triangle pattern is defined by a horizontal line of resistance at the top. When the price of the asset reaches this level, it bounces back down and does not yet break through the resistance. Think of this as a ceiling on the price that the asset can’t seem to quite break through. When it does finally break out, this could indicate a strong continuation of an upward trend.
Progressively higher bottoms
When the price of the asset moves down, its bottom points and support levels are progressively higher before it trends upward again. This typically means there is more demand from buyers before the asset descends to what would have been the previous low point. The buyers are willing to pay a continually higher price for the asset instead of letting it sink to the levels of the previous bottom.
At least two highs and two lows
The pattern should meet its horizontal resistance level at least twice and reach its progressively higher bottom support levels at least twice to be considered an ascending triangle pattern. That being said, it’s a good idea to wait for multiple high and low points to create an ascending triangle pattern. And look for the behavior of those in the market to be consistent during the consolidation phase. Many traders suggest choosing a repetition of anywhere from three to five times on both the resistance and the bottom lines.
Breakout point and continuing trend
Once the price breaks out of the pattern, there should be momentum in the price, which results in a significant trend upwards in a bullish pattern. Many traders are advised to buy at or close to the breakout point once the pattern has been identified. However, it’s possible that it could also be a false breakout, which would cause the price to fall back into the same pattern rather than truly breaking out.
Real-life example: Natco Pharma
Here is an example of an ascending triangle playing out with Natco Pharma stock.

You can see there is a horizontal line defining the resistance to the trade. You can also see higher and higher bottoms or swing lows. As the triangle begins to head towards its convergence point, you can see that the pattern of the triangle now consists of multiple lows that are progressively higher. Once it hits the convergence point between resistance and support, the stock breaks out of the pattern and trends continuously higher.
Investment brokerages like these are a great resource for understanding the market.
Why does an ascending triangle pattern occur?
A simple way to think about triangle patterns in trading is as a battle between buyers and sellers. The difference between ascending and descending triangle patterns is in who has the power. In an ascending triangle, the buyers have the power, and the sellers are holding down the line of resistance at the top.
Why is there a horizontal level of resistance in a triangle pattern?
As the triangle pattern indicates an upward trend, the sellers, or people shorting the stock, will have stop losses set towards the top of the pattern near the horizontal line. This accumulation of stop losses by sellers around the top cause it to form a horizontal line of resistance. Most trading textbooks will tell you that you should be short once you hit a level of resistance. However, when the price hits resistance several times, you would not want to short the market, as this indicates there is a continual upward trend. The power would then be in the hands of the buyers.
Why are there progressively higher bottom points?
The main reason there is an ascending line at the bottom of the triangle is because of the supply-and-demand metrics that favor the buyer. The pattern represents buyers not waiting for the price to drop to previous lows but instead buying at a higher low point than it reached before. Overall, there is more demand for buying the asset, which is reflected by the progressively higher support levels on the trade.
What is a breakout and why does it happen?
A breakout occurs when the pattern breaks out of the triangle shape. When looking to capitalize off of an ascending triangle, a trader would want a significant breakout in an upward trajectory. This would indicate that the buyers have the majority of the power, and the sellers are unable to hold the resistance line. The overall sentiment on the trade will favor the buyers, and there will be significantly more buying demand resulting in accumulation. (Accumulation is when traders increase their exposure to an asset.) In the context of an ascending triangle, the buyers continuously increase their positions and time frame with the belief that the asset will break through and continue in a bullish trend.
Ascending triangle pattern trading philosophy
Let’s review how traders would respond to an ascending triangle pattern.
When to buy
When looking to capitalize off of an ascending triangle, traders will most likely recommend that you set parameters to buy the asset after or close to when it breaks out of its pattern in an upward trajectory. Once the breakthrough occurs, then most traders will want to aggressively buy the asset, causing further accumulation and a strong upward trend in the price. If you are familiar with candlestick trading, you know that many traders have a rule to buy at the top or bottom of the candlestick range, on the candlestick that represents a break in the pattern. You can see an example of buying during a breakout below.
How to manage the downside
Most traders say that the way to manage the downside with an ascending triangle pattern is to set the stop loss in place at a reasonable level. Firstly, most traders would recommend finding the previous bottom of the asset price before it is near what you have defined as the breakout price. They would then give themselves a bit of a buffer and choose a price slightly below the previous bottom. By choosing a buffer, the traders are able to mitigate the risk of the price breaking lower than the previous level of support (bottom) and reversing to continue an upward trend. Likewise, should the triangle be a false breakout, or if it moves significantly in the other direction, the traders will have stop-lossed their position.
Pro Tip
Ascending triangle patterns are generally utilized while implementing a bullish trading strategy on a market that is trending up. However, traders can also use an ascending triangle pattern to short assets. A trader, for instance, can set a short position to be triggered if the price of the asset falls below the lower ascending line of the triangle.
Beware of false breakouts
A major risk in trading with ascending triangle patterns is the possibility of a false breakout. As many traders aim to buy at the breakout point, there can be upward movement at what many people set as their breakout point without the accumulation and price momentum to cause it to become a true breakout.
This is when it’s important to take a larger deep dive into the trading history of the asset. If there have been multiple false breakout levels in the past, this might be an indicator that the price might not fully break through.
FAQ
Is an ascending triangle bullish?
In most cases, yes, the ascending triangle pattern is typically an indicator that you expect the price to break out in a bullish manner.
What is an ascending triangle pattern?
The rule of thumb is that an ascending triangle pattern is defined by a horizontal line of resistance at the top, with progressively higher bottoms. It typically indicates that the power is in the hands of the buyers on the trade.
Can an ascending triangle pattern be bearish?
Yes, if the pattern emerges during a downtrend, it can sometimes indicate a bearish direction. However, for most traders, it is only utilized as a trading strategy during an uptrend in the market and is a bullish trading thesis.
Is the ascending triangle pattern good?
An ascending triangle pattern is good in the case of a general uptrend in the market.
Is a descending triangle bullish or bearish?
A descending triangle is generally considered bearish. That being said, in the context of an uptrend in the market, a descending triangle can occasionally be considered bullish.
Key takeaways
- An ascending triangle pattern is a chart pattern in which the top resistance level is a straight line, and the bottom support levels form an ascending slope.
- Ascending triangle patterns are generally used in a bullish investment thesis. However, on occasion, they can also be part of a bearish thesis.
- An ascending triangle pattern signifies that there might be a breakout event, where the triangle breaks through the pattern, and a significant swing in momentum occurs.
- Most traders will buy near the breakout point where the lines converge and set stop losses close to the trough of the most recent bottom, with some buffer room.
Share this post:
Table of Contents