Symmetrical Triangle Pattern
Summary:
A symmetrical triangle pattern is a trading pattern in which there are two converging trend lines connecting a series of tops and troughs with similar trend slopes. Unlike ascending and descending triangle patterns, the pattern represents a period of neutrality in which there is no definitive bullish or bearish bias in the market. The pattern can break shape in either an upswing direction or a downswing direction. Typically, there will be increased volume near the breaking point in either direction, which might indicate in which direction the price will break.
Some of the best advice a trader will give you is to separate the signal from the noise. In the world of trading, there is constant movement in either direction (and for a variety of reasons) which can be considered noise. Some of it is defined by the actual value of the asset and its macroeconomic support, and some of it is determined by the behavior of traders in the market. In some cases, patterns emerge during consolidation in which there is no clear-cut signal as to whether the trading thesis is definitively bullish or bearish. The symmetrical triangle is one of those types of patterns.
Get Competing Personal Loan Offers In Minutes
Compare rates from multiple vetted lenders. Discover your lowest eligible rate.
It's quick, free and won’t hurt your credit score
What is a candlestick pattern?
A candlestick pattern is a graphic representation of changes in price on a candlestick chart that some traders believe can predict future price movements. Bullish patterns predict increases in price, while bearish patterns indicate that the price may drop. Check out our in-depth article about how to read these charts and some other common patterns.
What is a symmetrical triangle?
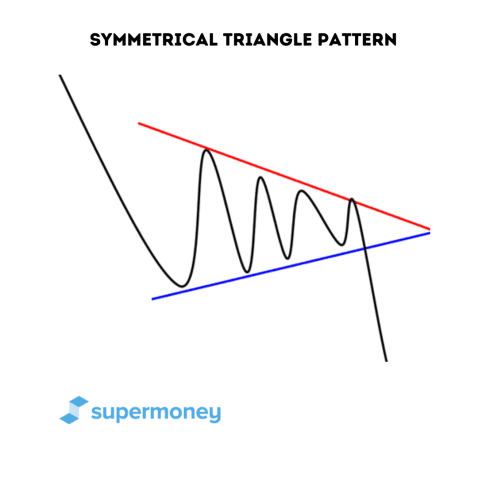
The symmetrical triangle is a continuation or reversal pattern defined by various peaks and troughs that are connected by downward and upward trend lines with relatively equal slopes. In essence, the top trend line will slope downward, and the bottom trend line will slope upward. Eventually, these two lines will meet at a point. This is when the asset might be able to break through the triangle shape and continue a longer-term trend either downward or upward.
A symmetrical triangle is a volatility contraction pattern. This means that the volatility in the market is shrinking, and there is a decent probability that the price will reach a point where it breaks in either direction. It sometimes resembles a funnel, with the price being effectively squeezed from left to right. The two equal slopes will converge at the breaking point, and the price will theoretically have nowhere to go. Traders will utilize a symmetrical triangle pattern, along with further technical analysis, to make a trade or play on the price of an asset.
What makes up a symmetrical triangle pattern?
As opposed to an ascending or descending triangle, a symmetrical triangle will typically have a neutral trading bias. Below is an example of what this pattern looks like and the elements that cause it to be a viable pattern.
Consolidation
Consolidation occurs when the market is trading within a range but hasn’t broken out significantly in either direction. This is caused by traders being indecisive with their trades, whether buying or selling. However, in this consolidation time frame, small patterns can emerge that indicate a significant break in one direction or another.
Progressively lower tops
The symmetrical triangle pattern will have progressively lower highs, similar to what you see in a descending triangle pattern. These progressively lower highs cause the top trend line to slope downward. As the sellers attempt to push the price down, they are met with pushback in the form of support from the buyers. However, this downward pressure is pushed back by the buyers. As the market progresses, the price point where the buyers will support the asset at becomes lower and lower.
Progressively higher bottoms
The symmetrical triangle pattern will contain progressively higher low points. The progressively higher lows will cause the bottom trend line to slope upward. The buyers look to increase the price, but they are met with resistance from the sellers. As the market progresses, the price point at which the sellers will offer resistance becomes higher and higher.
Multiple points hit
The pattern should hit its equally sloped bottom troughs and high peaks at least two times, but most traders will advise that you wait longer. Remember, a symmetrical triangle represents a volatility contraction, meaning you are effectively waiting for the market to settle down. By waiting longer, for, say, three to five points for the pattern to emerge, traders will suggest that this indicates the pattern is forming and volatility is contracting. Symmetrical triangles are neutral patterns, and there is no price momentum in one direction or another, so many traders tend to err on the side of waiting.
Possible break point in either direction
The breakpoint in a symmetrical triangle pattern is the point that the points of the triangle converge. Remember, the funnel is pushing the price from left to right until the price spread shrinks considerably, and the trend lines now converge. There might then be the possibility of a break in either direction.
Real-life example: Narayana Hrudayala stock
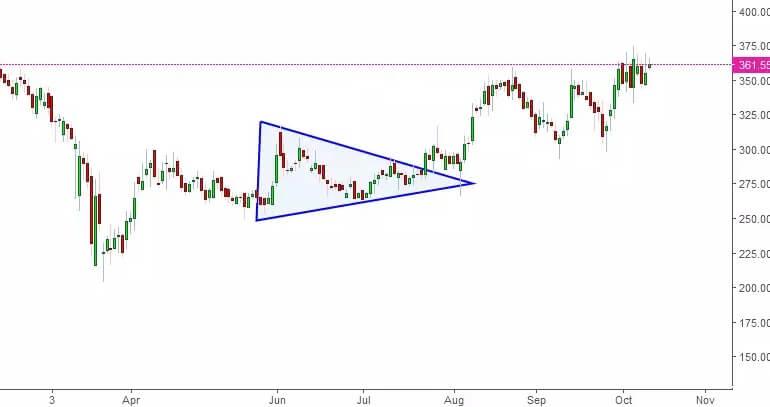
Here is an example of a real-life symmetrical triangle pattern based on an Indian company called Narayana Hrudayalaya. From February to April, the price point of the stock declined significantly. In April, the stock price started to increase significantly. Then there was a leveling out, and in June, a symmetrical triangle pattern formed.
The triangle ended up breaking out upwards, causing the price to increase and rise on a generally ascending trend line. Although this chart does not indicate volume, there is a good chance that trade volume piled into the buy side right as the price started to break out.
Looking to trade symmetrical triangle patterns but don’t know where to start? These brokerages can help.
Why does a symmetrical triangle pattern occur?
A symmetrical triangle pattern occurs because there is no advantageous position for either the buyers or the sellers, and thus the lines slope equally. Remember, in an ascending triangle, the buyers are in an advantageous position and hold the power; thus, the bottom trend line slopes. In a descending triangle, the sellers are in an advantageous position and hold the power; thus, the top trend line slopes. In a symmetrical triangle, neither the sellers nor the buyers hold the power. Remember that in the world of triangle patterns, slope equals power. So the equal slopes of a symmetrical triangle represent an equal playing field.
Why are the slopes equal on a symmetrical triangle?
Remember, the world of trading is really two sides battling each other: the buyers and the sellers. When the buyers try to push the price up, the sellers react by pushing it down. When the sellers try to push the prices down, they are met with support or resistance from the buyers. Both the buyers’ and the sellers’ positions are equally eroded, which results in the slopes of the trend lines being equal. This runs in contrast to a wedge, where the slopes of the lines favor one side or the other. The general neutrality of the pattern can also be referred to as “trading sideways.
Breaking in either direction
A break happens in either direction once the triangle reaches its convergence point. Many times, there will be an increased volume of trading activity in either direction as the triangle reaches its convergence point. Sometimes, the direction that the triangle breaks will be influenced by what preceded it. In the case of a preceding bearish market, the pattern might breakout downward. In the case of the preceding bullish market, the pattern might break upward.
Symmetrical triangle trading philosophy
Let’s review how traders would respond to a symmetrical triangle pattern.
When would traders open a trade?
Many traders will look at where the volume of the trade orders is headed to make an educated guess about which direction the triangle might break. If there are lots of short and selling volume orders near the breakpoint, this might indicate that the triangle will break down and start to decline significantly. Likewise, if there is more volume on the buy side before the triangle breaks, this could indicate that the price might break upwards out of the triangle pattern.
This obviously doesn’t take into account what the preceding history of the asset price was. As mentioned above, a trader might want to open up a trade incorporating the history of the asset price and market before the triangle pattern took place. However, many technical traders will prefer to buy after the breakpoint has been fully established; otherwise, they run the risk of chasing the break and failing.
Chasing the break in a symmetrical triangle
Chasing the break in either direction in a neutral pattern, like a symmetrical triangle, can be risky. You might get a false breakdown or a false break out in either direction. Some traders will opt to trade right as the price breaks the pattern. In a symmetrical triangle pattern, however, some might opt to wait until the price hits a retest level on the other side that it broke from. Remember, with sideways trading, such as a symmetrical triangle pattern, the market is being indecisive.
Pro Tip
Many people trading a symmetrical triangle pattern will choose the end of the candlestick after it breaks in one direction or even the next few candlesticks. This is how they hedge against the possibility of false breaks.
How traders manage the downside
The downside for any trader in trading based on a symmetrical triangle pattern is that the pattern breaks in the opposite direction that they bet on. In this case, many traders would recommend putting a buy stop or stop loss on either side of the triangle, depending on if they are buying or shorting. If they feel the price will break downward but want to protect themselves, they might be inclined to put a buy stop order near the peak of the previous top-line downward trend. Likewise, if they are betting that the price goes up, many will put a stop loss order near a price point that is close to the previous peak of the ascending bottom slope.
If you are looking at trading using triangle patterns but don’t have a solid retirement plan yet, you might want to consider speaking to an advisor. Use our tool to compare different advisors.
FAQ
Is a symmetrical triangle pattern bullish?
Symmetrical triangle patterns are not bullish and bearish by nature; they are neutral. However, if the previous trend was bullish before the triangle pattern formed, it could trend towards bullish rather than bearish. This could be considered a bullish symmetrical triangle pattern.
Is a triangle pattern bullish or bearish?
They are all different. An ascending triangle is mostly bullish, and a descending triangle is mostly bearish, although there are some exceptions. A symmetrical triangle is considered neutral unless it is preceded by a bullish or bearish market.
How do you trade a symmetrical triangle pattern?
Most traders would say that in a symmetrical triangle trading strategy, it’s important not to chase the break too much. Once it breaks and you have a position, you can manage the downside by putting a stop loss or buy stop at the opposite side of the way the pattern broke.
Is a symmetrical triangle a reversal pattern?
A symmetrical triangle is generally considered a continuation pattern and not a reversal pattern. There are certain instances, however, when it could be a reversal pattern. If there is a downward breakout after an uptrend, this would indicate a reversal pattern.
What does a symmetrical pattern mean?
A symmetrical pattern means that the top and bottom trend lines are perfectly symmetrical. Their slopes are roughly the same.
Key takeaways
- A symmetrical triangle chart pattern is a trading pattern in which there are two converging trend lines connecting a series of tops and troughs with similar trend slopes.
- A symmetrical triangle pattern usually indicates a sideways direction of the market, in which there is no advantage for the buyers or the sellers.
- If the symmetrical triangle pattern was preceded by a bullish or bearish period, you could infer that the triangle will break towards the preceding direction.
- Typically there will be increased volume near the breaking point in either direction, which might indicate in which direction the price will break.
Share this post:
Table of Contents