US Tariff Revenue as a Percent of Total Government Revenue Long Term Trend
Last updated 02/10/2025 by
SuperMoney Team
Edited by
Andrew Latham
Summary:
A historical analysis of U.S. tariff revenue as a percentage of total government revenue reveals a dramatic decline over the past two centuries. Once the dominant source of federal revenue—accounting for over 80% in the early 19th century—tariffs have fallen to less than 5% since the mid-20th century. This shift reflects the adoption of income and payroll taxes, as well as the rise of free trade policies. The data highlights the transition from protectionism to globalization, illustrating how government funding has evolved beyond tariffs.
A historical analysis of U.S. tariff revenue as a percentage of total government revenue highlights a dramatic decline over the past two centuries. The data, covering the period from 1795 to May 2019, illustrates how tariffs were once the dominant source of federal revenue but have since become a marginal component of government finances.

In the early 19th century, tariffs accounted for over 80% of total government revenue, reflecting their crucial role in funding the federal government before the income tax system. The chart reveals sharp fluctuations, likely tied to economic cycles, trade policies, and wars. However, a significant and sustained decline began in the late 19th century, coinciding with industrialization and fiscal policy changes.
By the early 20th century, tariff reliance declined further as corporate and individual income taxes were introduced—especially after the ratification of the 16th Amendment in 1913, which allowed a federal income tax. The sharp drop after World War II reflects the shift toward free trade policies and lower tariff rates, as the U.S. integrated into the global economy.
Since the mid-20th century, tariff revenue has remained below 5% of total government revenue, emphasizing the U.S. government’s shift toward income and payroll taxes rather than trade duties. This trend continues into the 21st century, with tariffs playing a negligible role in overall federal revenue collection.
While the long-term trend shows tariffs becoming a negligible part of total government revenue, data from the World Bank provides additional insight by looking at customs and import duties as a percentage of total tax revenue rather than total revenue. From 1974 to 2023, this percentage has fluctuated between 1.5% and 3.6%, peaking during major trade policy changes.
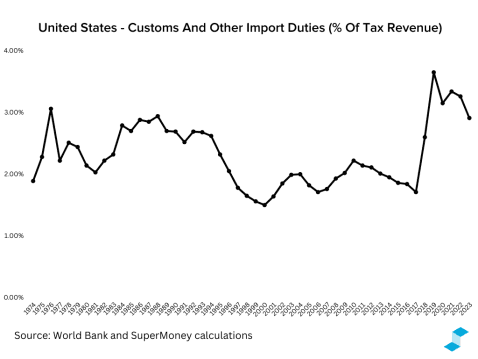
One significant peak occurred in 1975 (3.06%), during a period of heightened global economic uncertainty following the 1973 oil crisis. As inflation surged and economic growth slowed, the U.S. government relied more on tariffs to manage its fiscal position. Additionally, President Gerald Ford supported policies aimed at stabilizing domestic industries affected by global market fluctuations, including trade protections and tariffs on specific imports.
A more recent peak in 2019 (3.65%) occurred during the Trump-era tariff policies, which included tariffs on Chinese imports, steel, and aluminum. These measures temporarily increased tariff revenue but did not reverse the long-term downward trend.
Key takeaways
- In the early 19th century, tariffs contributed over 80% of U.S. government revenue.
- A sharp decline began in the late 19th century, as new tax systems emerged.
- The 16th Amendment (1913) introduced a federal income tax, further reducing tariff reliance.
- Post-World War II, free trade policies diminished tariff revenue to below 5%.
- Today, tariffs contribute a negligible share of total U.S. government revenue.
- World Bank data shows customs and import duties fluctuating between 1.5%–3.6% of tax revenue from 1974 to 2023.
- The 1975 peak (3.06%) followed the 1973 oil crisis, as tariffs were used to stabilize domestic industries.
- The 2018–2019 tariff spike (3.65%) was driven by Trump’s tariffs on China, steel, and aluminum, but it remained a small share of overall tax revenue.
Share this post:
Table of Contents