

Industry Study
2026 Personal Loan Interest Rate Study: Same Borrower, Very Different Prices

Last updated 10/12/2026 by
Miron Lulic
Edited by
Andrew Latham
Where you shop for a personal loan can matter more than moving up a credit band. In 132,644 prequalified offers made through SuperMoney over the past 12 months, lenders quoted the same borrower APRs an average of 6.2 percentage points apart for the exact same loan, and 10 points or more in one of every five comparisons. That gap is bigger than the rate difference between the 720+ and 680–719 credit bands. For borrowers with four or more offers, comparing all of them instead of checking a single lender saved about $2,000 in interest on average.
You’d expect personal loans to work like a commodity. Money is money. Lenders pay similar benchmark rates for their own funding, and a borrower has no reason to pay one lender more than another for the same cash. So the same person should get roughly the same price everywhere.
They don’t. Lenders weigh risk differently, pay different amounts for their funding, and use different underwriting models. Some cut rates to win customers, and others price for profit. The result is that one borrower can be quoted very different prices for the same loan.
That matters in a market this size. TransUnion reports that Americans owed a record $281 billion in unsecured personal loans in Q2 2026, up 9.6% from a year earlier, across 26.9 million borrowers (source). If all of that debt were repriced just 3 percentage points lower, borrowers would save about $15 billion in interest over three years.
Get Competing Personal Loan Offers In Minutes
Compare rates from multiple vetted lenders. Discover your lowest eligible rate.
It's quick, free and won’t hurt your credit score
How we measured it
SuperMoney’s loan offer engine sends one application to many lenders, including SoFi, Happen (formerly LendingClub), Prosper, Best Egg, Happy Money, Citi, and Avant. Each lender responds with prequalified offers based on a soft credit check. That gives us something published rate ranges can’t: real prices from competing lenders for the same loan to the same person.
We looked at offers made between 24 September 2025 and 23 September 2026. We focused on standard installment loans, with APRs of 36% or less and terms of 12 to 84 months. Then we matched up offers for the same borrower, loan amount, and term whenever at least two lenders quoted that loan. That produced 9,468 head-to-head comparisons across 1,838 borrowers.
Same borrower, same loan, 6 points apart
On average, the lowest offer in each comparison was 16.24% APR and the highest was 22.44%, a gap of 6.2 percentage points. Half the time (51%), the offers were at least 5 points apart. About one time in five (19%), they were 10 or more points apart. The widest gap we found was 29 points.
| Loan term | Comparisons | Avg. lowest APR | Avg. highest APR | Avg. gap | Gap of 10+ pts |
|---|---|---|---|---|---|
| 24 months | 750 | 11.98% | 19.55% | 7.6 pts | 29% |
| 36 months | 3,382 | 16.66% | 23.44% | 6.8 pts | 23% |
| 48 months | 2,080 | 15.43% | 20.72% | 5.3 pts | 14% |
| 60 months | 3,160 | 17.45% | 23.35% | 5.9 pts | 18% |
| All terms | 9,468 | 16.24% | 22.44% | 6.2 pts | 19% |
The gap was widest on 24-month loans (7.6 points) and narrowest on 48-month loans (5.3 points). There were too few 72- and 84-month offers to draw conclusions.
Case study: what checking one lender would have cost
Picture yourself as this borrower. It’s June 2026, your credit score is 720 or higher, and you want to borrow $20,000 over three years. You fill out one application on SuperMoney, and five lenders send back prequalified offers for exactly that loan:
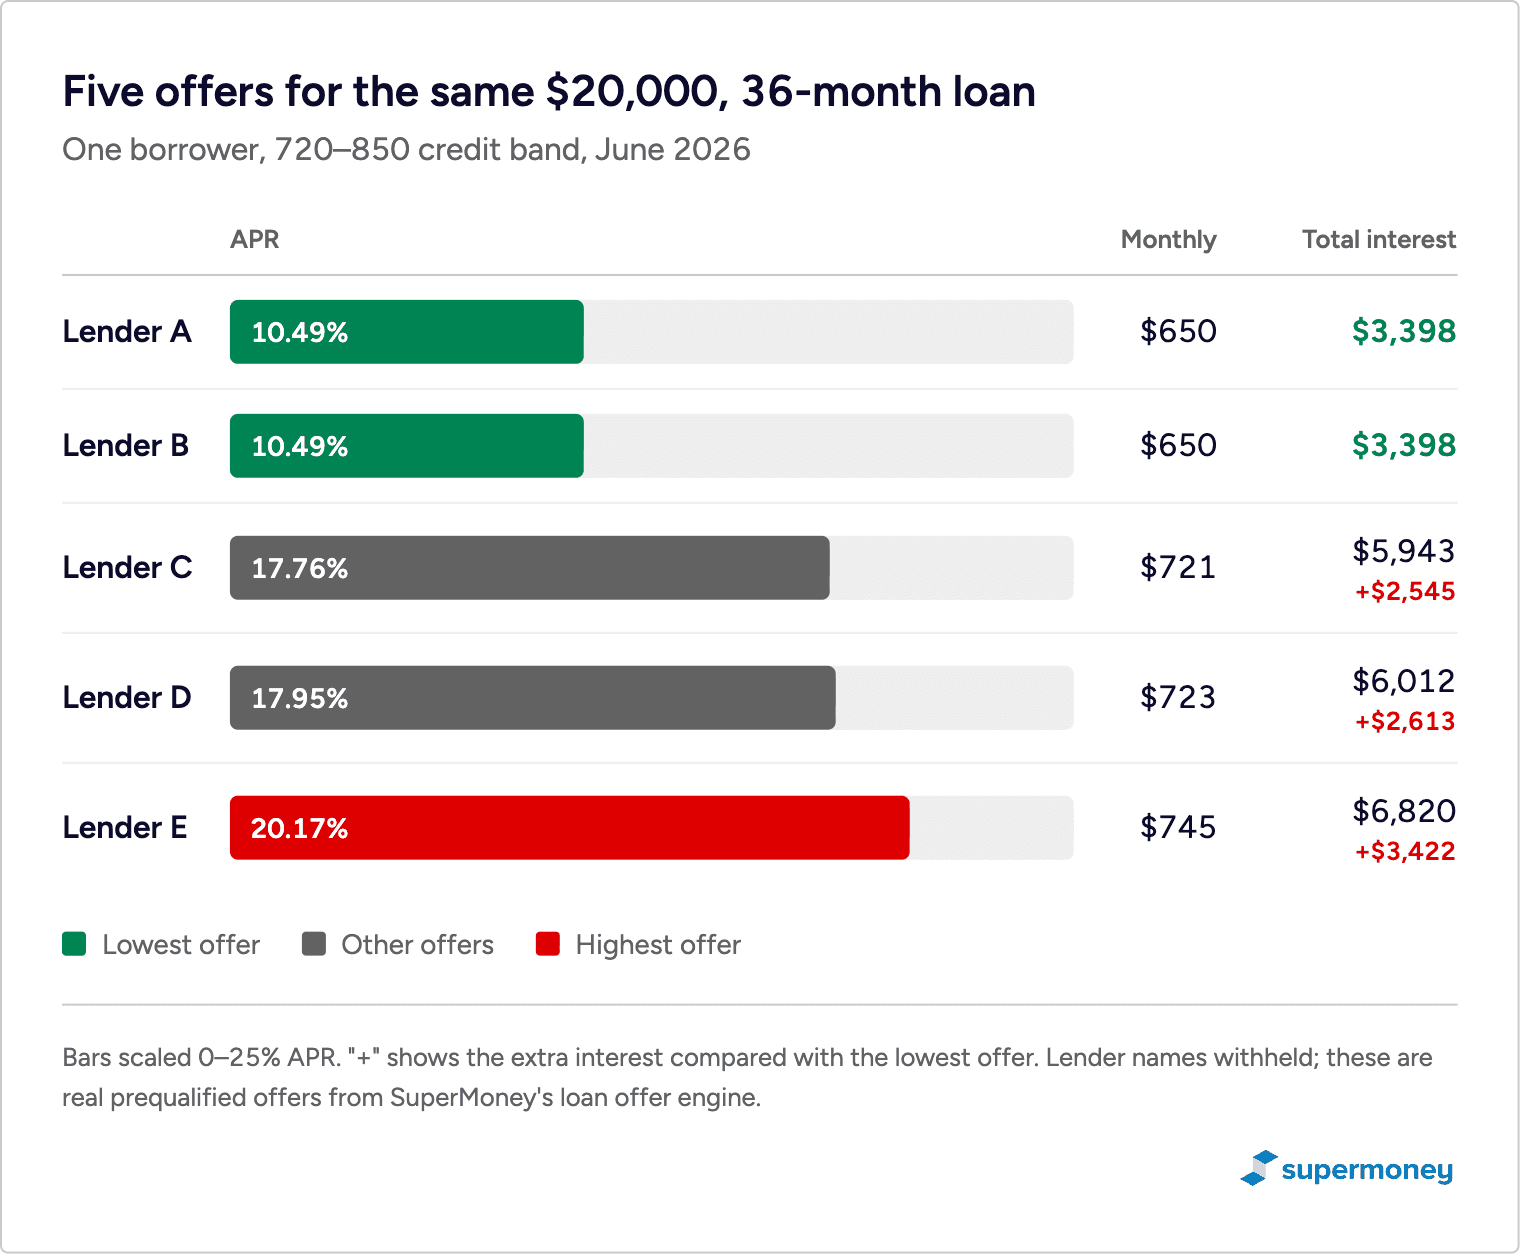
Now suppose you’d applied to just one of those lenders. Only two of the five offered the lowest rate. Pick any of the other three and you’d pay 7 to nearly 10 percentage points more for the same money.
With Lender E, you’d pay 20.17% instead of 10.49%. That’s $95 more a month for three years, or $3,422 in extra interest. Your credit, income, loan amount, and term would be exactly the same. The only thing that changed is which lender you asked.
This borrower’s 9.7-point gap is bigger than the 6.8-point average for 36-month loans, but it’s far from rare. Nearly one in four 36-month comparisons (23%) had a gap of 10 points or more. That’s why we recommend comparing at least three or four lenders.
Shopping around can be worth more than a higher credit score
Your credit score still has the biggest say in the rates you’re offered. But within each credit band, the gap between lenders was bigger than the gap between bands.
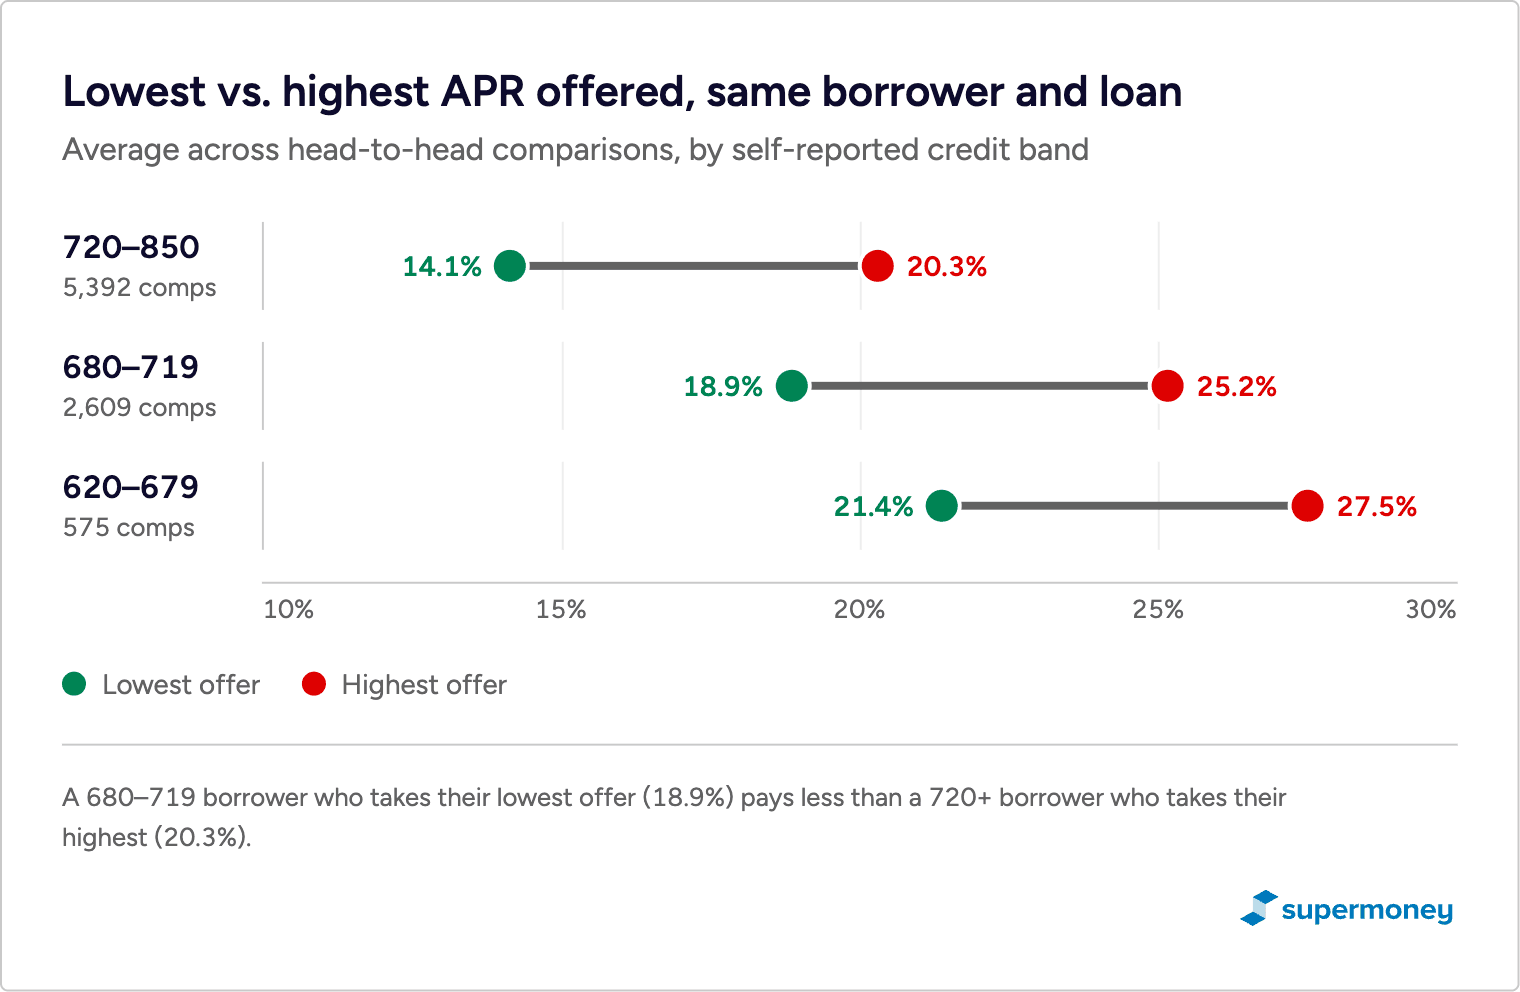
Borrowers with 720+ credit got lowest offers that averaged 4.7 points below those in the 680–719 band. But the offers 720+ borrowers received were 6.2 points apart. In other words, picking the right lender was worth more than moving up a full credit band. One band down, the pattern is even stronger: the 680–719 band’s lender gap (6.3 points) is more than double its rate advantage over the 620–679 band (2.5 points).
The gap was nearly identical in every band, between 6.1 and 6.3 points. This isn’t just a problem for borrowers with weak credit. Someone with excellent credit who takes the first offer can easily overpay.
Every extra offer you compare improves your odds of a lower rate
Because lenders price the same borrower differently, each additional offer is another chance at a lower rate. To measure what that’s worth, we looked at borrowers who received four or more offers for the same loan and asked: what would they have paid if they’d only compared some of them?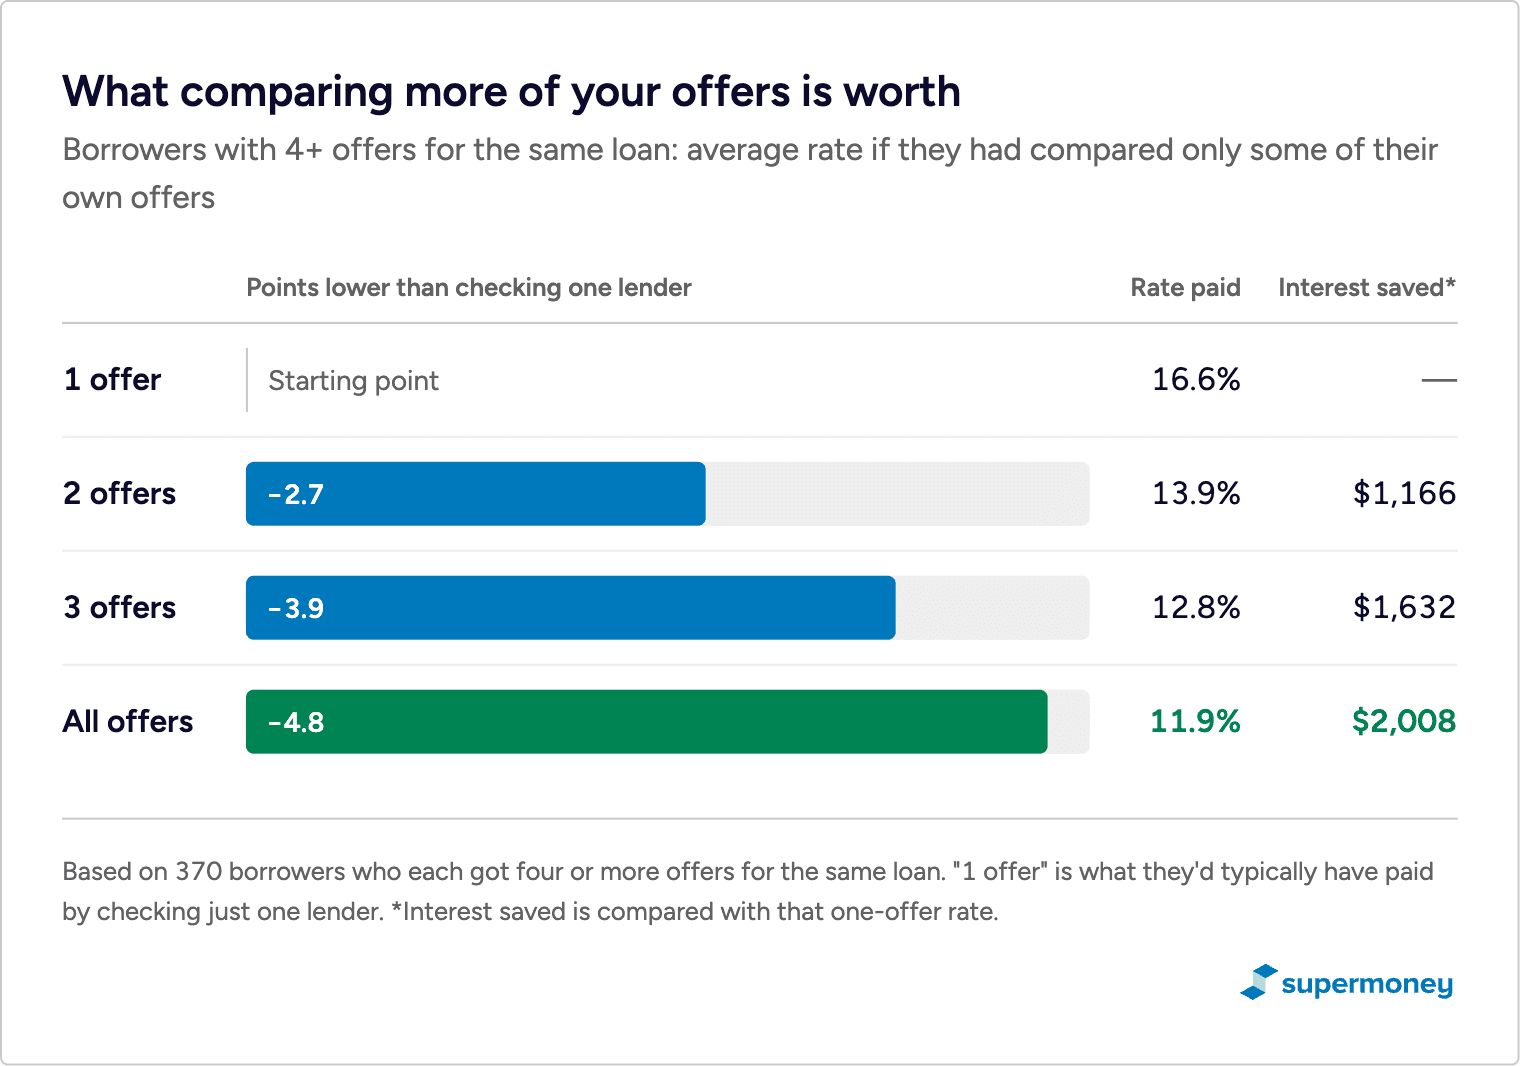
These are the same borrowers and the same loans in every row. The only thing that changes is how many of their offers they compared. Checking one lender at random, they’d have paid 16.63% on average. Comparing two brought that down to 13.90%, three to 12.78%, and all of their offers to 11.88%. That’s about $2,000 in interest saved just by looking at every offer instead of one. The pattern holds for 720+ borrowers too: 15.55% with one offer, 10.97% with all of them.
Even two offers make a difference. Among all borrowers with exactly two offers for the same loan, taking the lower one saved 2.7 points compared with a typical offer.
One caution: borrowers who receive more offers also tend to have stronger credit profiles. That’s why we don’t compare borrowers with different numbers of offers directly. The figures above hold the borrower fixed.
What the gap costs you in dollars
A few percentage points add up quickly, especially on larger loans. Here’s the average interest saved by taking the lowest offer, by loan size:
| Loan amount | Avg. loan | Avg. gap | Saved vs. highest offer | Saved vs. average offer |
|---|---|---|---|---|
| Under $5,000 | $2,965 | 6.9 pts | $416 | $198 |
| $5,000–$9,999 | $6,726 | 6.6 pts | $1,013 | $484 |
| $10,000–$19,999 | $13,581 | 6.3 pts | $2,164 | $1,028 |
| $20,000–$34,999 | $25,766 | 5.8 pts | $3,769 | $1,810 |
| $35,000+ | $41,335 | 5.3 pts | $5,404 | $2,488 |
Even against a typical offer rather than the most expensive one, taking the lowest offer on a $35,000+ loan saved about $2,500.
Below 680 credit, few borrowers get an offer at 36% APR or less
Comparing offers only helps if you get more than one. Many borrowers don’t. Among borrowers who received at least one offer of any kind, the share who got a standard installment offer (36% APR or less) falls sharply with credit:
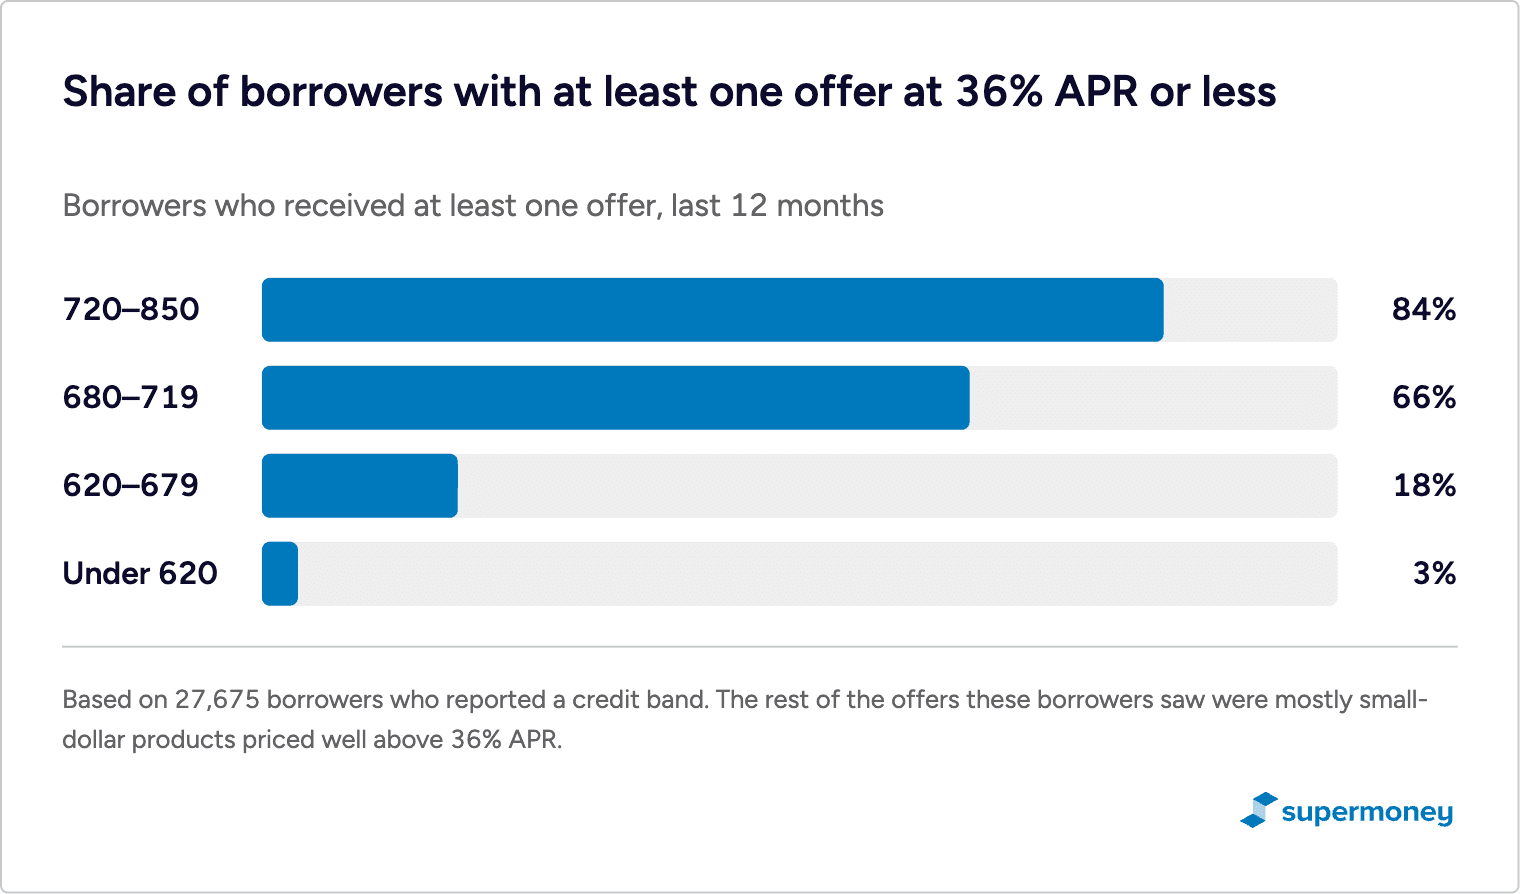
Below 680, the most important step is often not finding the lowest APR but avoiding high-cost loans altogether. Better options may include a secured loan, a credit-builder loan, a co-signer, or improving your credit before you borrow.
Rates eased over the past year, and the gap narrowed
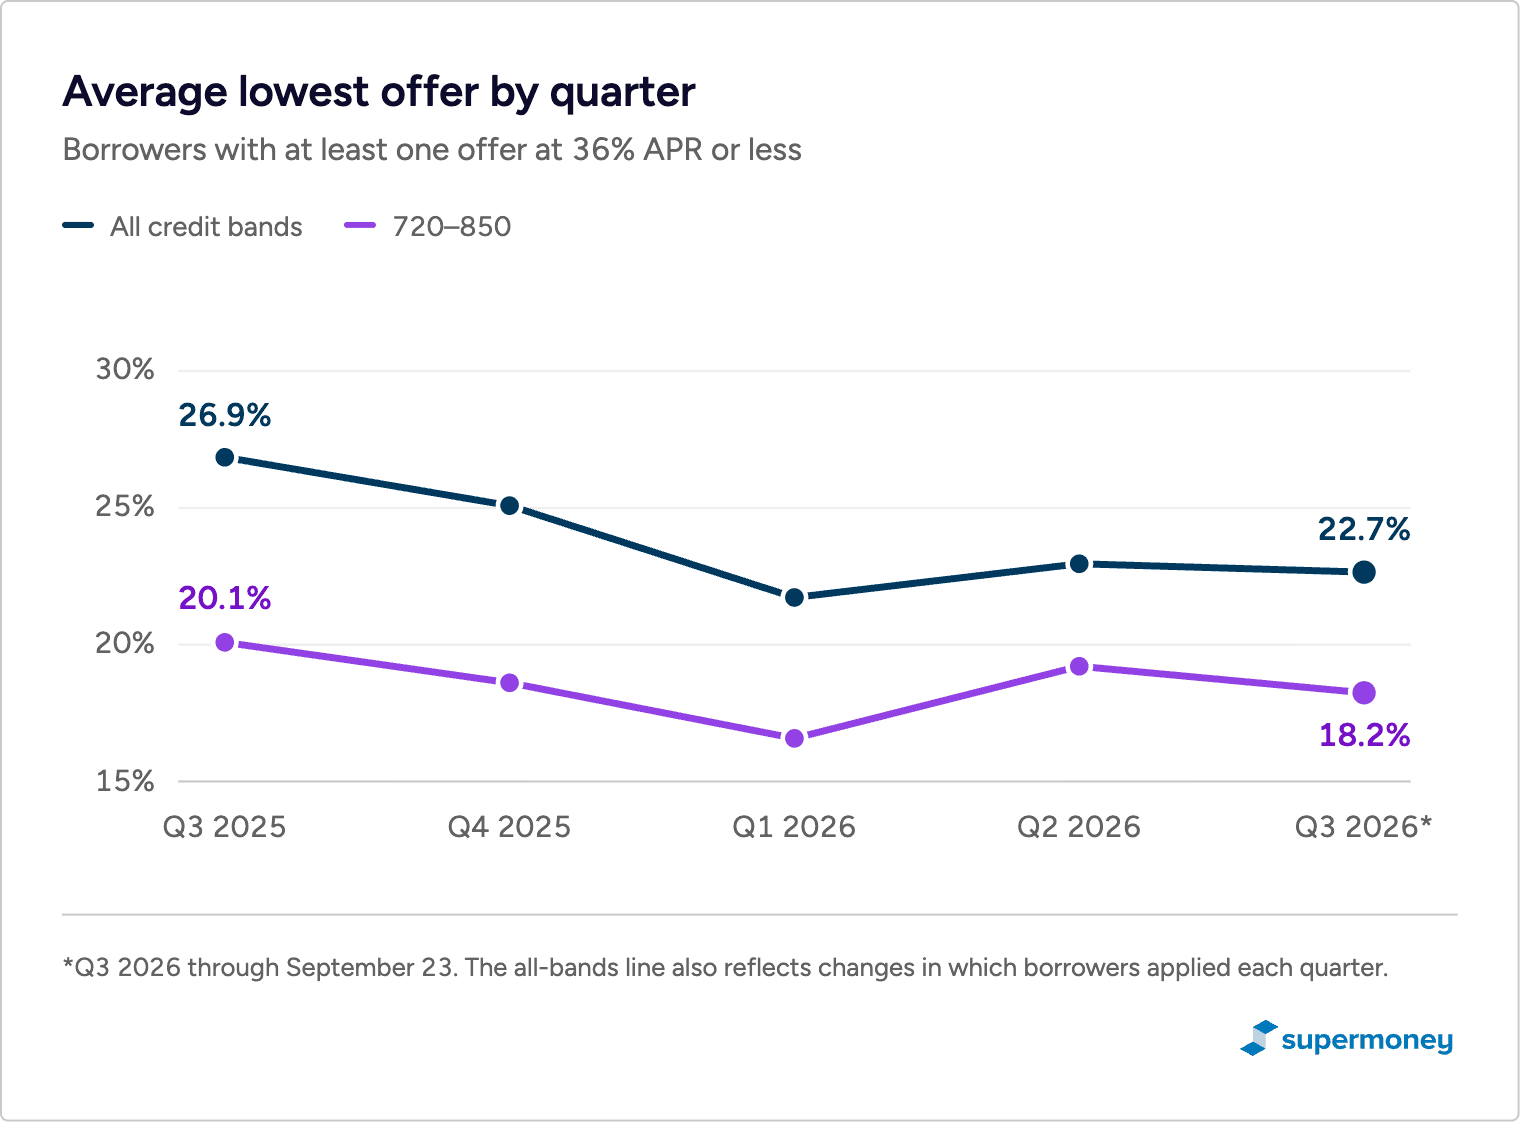
The average lowest offer fell from 26.85% in Q3 2025 to 22.65% so far in Q3 2026. Part of that drop reflects a shift in who applied, though. Within each credit band, the declines were smaller: 1.8 points for 720+ borrowers (20.08% to 18.24%), 3.4 points for 680–719, and 4.8 points for 620–679. The gap between lenders on the same loan also narrowed, from 7.7 points to 5.3 points. That’s good news, but a 5-point gap is still worth thousands of dollars on a typical loan.
Why many borrowers don’t shop around
Plenty of borrowers check one or two lenders at most. Some assume every lender charges about the same for their credit score. As this data shows, they don’t. Others don’t have time, or worry that applying to several lenders will hurt their credit. That worry makes sense when every application means a hard credit check.
Prequalification removes most of that friction. Many lenders now show you real rates with a soft credit check, which doesn’t affect your score. A multi-lender marketplace lets you compare several offers side by side in a few minutes.
Key takeaways
- When two or more lenders quoted the same loan to the same borrower, the lowest and highest APRs offered were 6.2 percentage points apart on average, across 9,468 comparisons.
- Half the time, offers were at least 5 points apart. About one time in five, they were 10 or more points apart.
- The gap was widest on 24-month loans (7.6 points) and narrowest on 48-month loans (5.3 points).
- Shopping around can beat a better credit score. The lender gap for 720+ borrowers (6.2 points) is bigger than the rate advantage of 720+ credit over 680–719 (4.7 points).
- Every offer you compare improves your odds. Borrowers with four or more offers would have paid 16.63% on average by checking one lender at random, but 11.88% by comparing all of them, saving about $2,000.
- Taking the lowest offer instead of the highest saved an average of $3,769 on $20k–$35k loans and $5,404 on loans of $35k or more.
- Among borrowers who received an offer, 84% of those with 720+ credit got at least one at 36% APR or less. Only 3% of those under 620 did.
- Offers improved over the past year. Within credit bands, the average lowest offer fell 1.8 to 4.8 points, and the gap between lenders on the same loan narrowed from 7.7 to 5.3 points.
While personal loans offer flexibility, it’s crucial to use them responsibly. Discover which purchases are best avoided.
Methodology
- Data: Prequalified offers returned to borrowers who applied through SuperMoney’s personal loan offer engine between 24 September 2025 and 23 September 2026. Each application counts as one borrower. Fewer than 1% of borrowers applied more than once.
- Study sample: Installment offers with APRs from 1% to 36% and terms from 12 to 84 months. That’s 132,644 offers to 6,316 borrowers from 13 lenders. Higher-APR offers were almost all small-dollar products under $10,000.
- Comparisons: One borrower, one term, and one loan amount, with offers from at least two lenders. When a lender returned several offers for the same combination, we used its lowest APR. The gap is the highest lender APR minus the lowest. “Lowest offer” means the lowest APR a borrower was offered through SuperMoney, not the lowest rate they could get anywhere.
- Averages: Each comparison or borrower is counted once, so borrowers who received many offers don’t dominate the results.
- Credit bands: Borrowers self-reported their credit band, and bureau scores weren’t used. The under-620 band had too few multi-lender comparisons for gap figures.
- Comparing more offers: For borrowers with four or more offers for the same loan, the rate for comparing k offers is the expected lowest APR among k of that borrower’s own offers, chosen at random. Every row uses the same borrowers.
- Access to offers: Shares are of borrowers who received at least one offer of any kind (28,490 of 203,902 personal loan applicants). Applicants who received no offers aren’t included.
- Trend: The quarterly gap between lenders uses the same method as the 6.2-point headline (same borrower, term, and loan amount). The all-bands average also reflects changes in who applied each quarter, so we report within-band changes as well.
- Interest savings: Total interest under standard amortization at each APR for the comparison’s actual amount and term.
- Changes from our previous study: Earlier versions compared all offers to a borrower for the same term, regardless of loan amount. On that looser basis, this year’s gap is 8.7 points (vs. 7.1 previously). We now also control for loan amount, which gives the stricter 6.2-point figure used throughout.
- Limits: These are offers to borrowers who used SuperMoney, not a random sample of the U.S. market, and prequalified offers can change at final approval. Lower credit bands mostly reflect the mix of SuperMoney applicants and shouldn’t be read as national averages.
Miron Lulic is founder and CEO at SuperMoney, a service that helps millions of people transparently compare financial services such as loans, investments, and more.
Share this post:
Add as a preferred source on Google
Table of Contents