

Industry Study
Auto Loan Statistics 2026: Average Car Payment, Rates, Debt and Delinquency in Every State

Summary:
Americans owe $1.71 trillion on auto loans, the average new-car payment has hit a record $787, and one in four new loans now stretches to 84 months or longer. Serious delinquency sits at its highest level since 2010, driven almost entirely by borrowers with credit scores under 620. This study pulls the latest data from the New York Fed, the Federal Reserve, Experian, TransUnion, Equifax, Cox Automotive, Edmunds and the CFPB into one place, adds a 50-state comparison nobody else publishes, and shows what the numbers mean for your next car loan or refinance.
Data through Q2 2026 (New York Fed, Experian), Q3 2026 (TransUnion, Edmunds, J.D. Power) and August 2026 (Federal Reserve, Equifax). Each chart carries its own source and period. We refresh this page every quarter.
Get Competing Auto Loan Offers In Minutes
Compare rates from multiple vetted lenders. Discover your lowest eligible rate.
It's quick, free and won’t hurt your credit score
Key findings
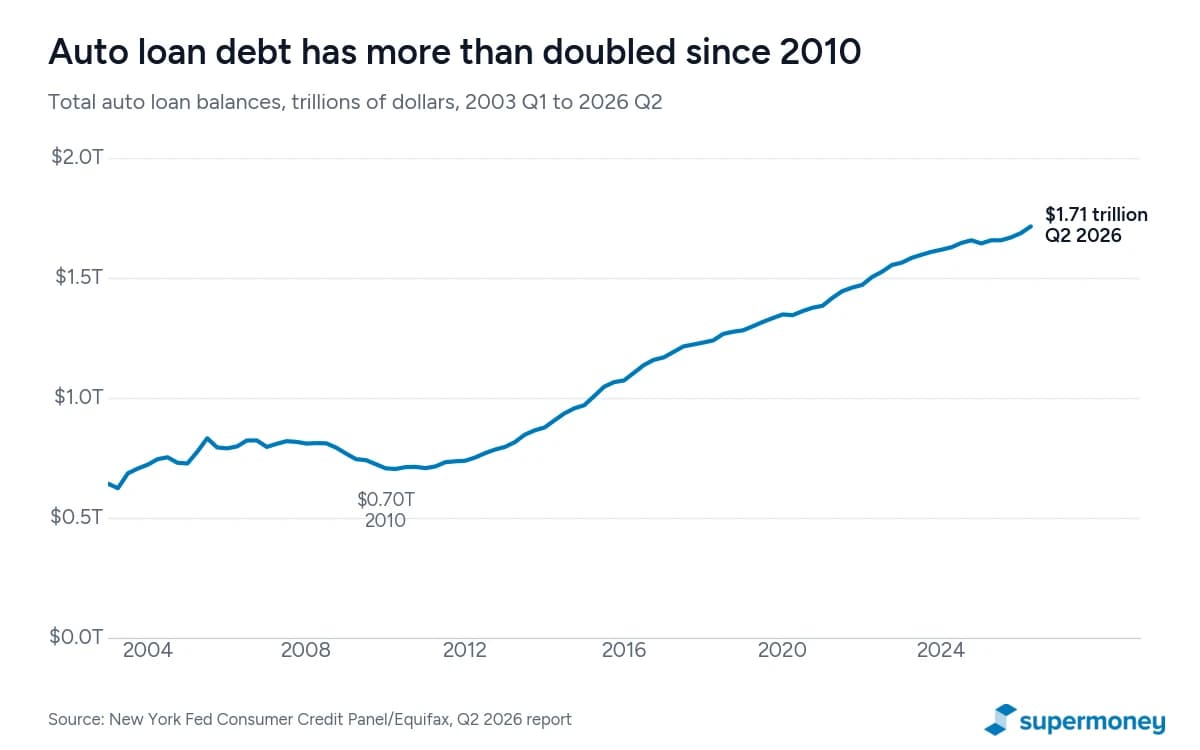
- Auto loan balances reached $1.713 trillion in Q2 2026, up $28 billion in a quarter and $58 billion in a year. Auto loans are 9.1% of all household debt (New York Fed).
- The average new-car buyer financed a record $44,664 and pays $787 a month at 7.0% APR (Edmunds, Q3 2026). J.D. Power’s October reading was higher still at $823.
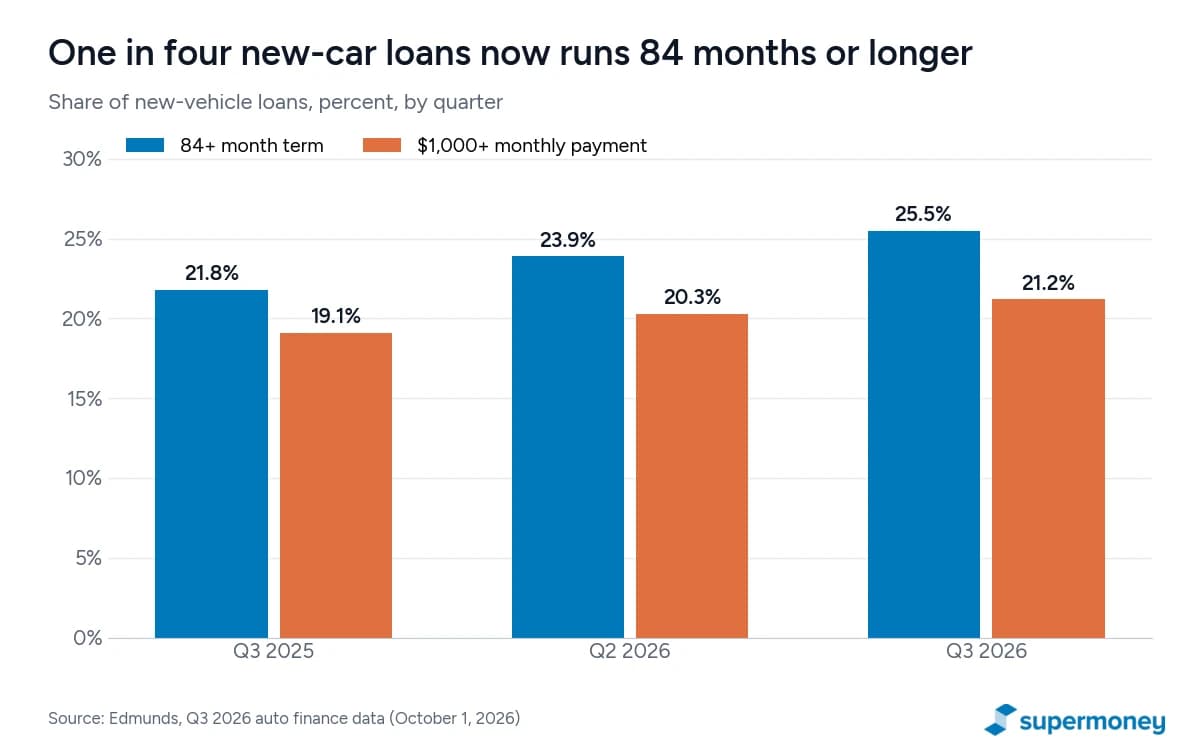
- 21.2% of new-car buyers pay $1,000 or more a month, a record, and 69% of them signed loans of 72 months or longer (Edmunds).
- 25.5% of new-car loans run 84 months or more (Edmunds), and loans over 72 months hit a record 31.8% of all financed deals (Cox Automotive, September 2026).
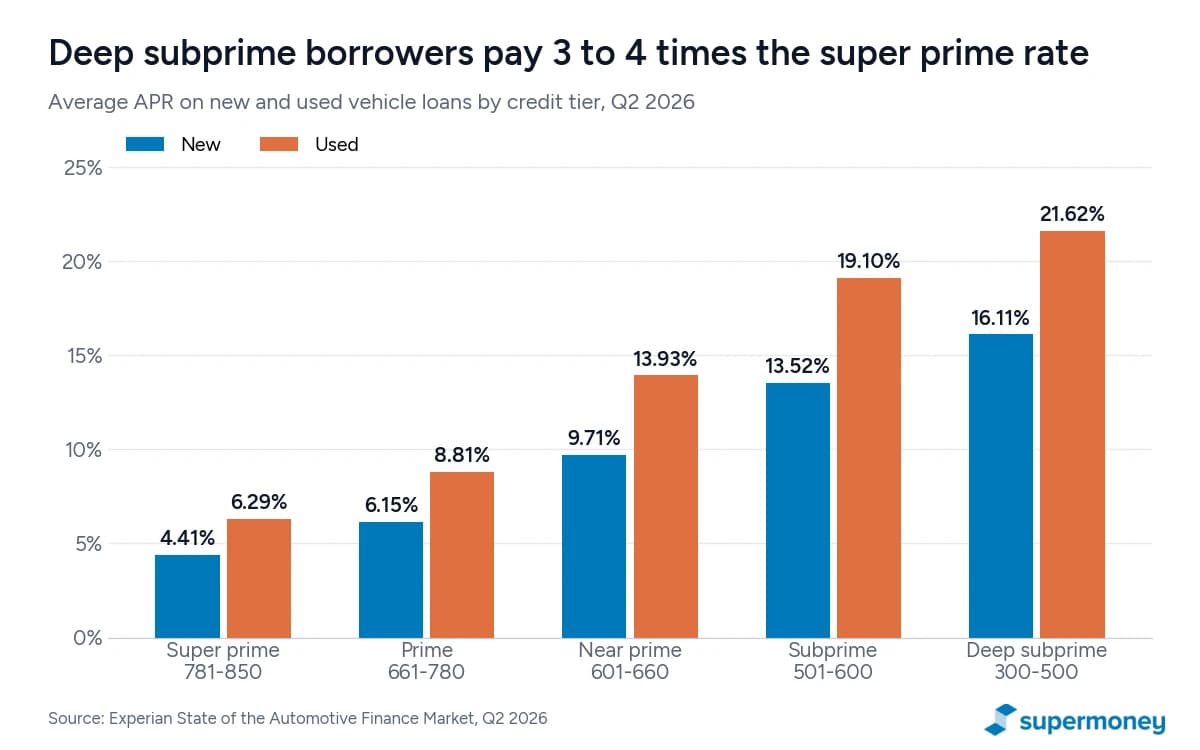
- The average APR is 6.35% on new and 11.19% on used vehicles. Deep subprime borrowers pay 16.11% on new and 21.62% on used (Experian, Q2 2026).
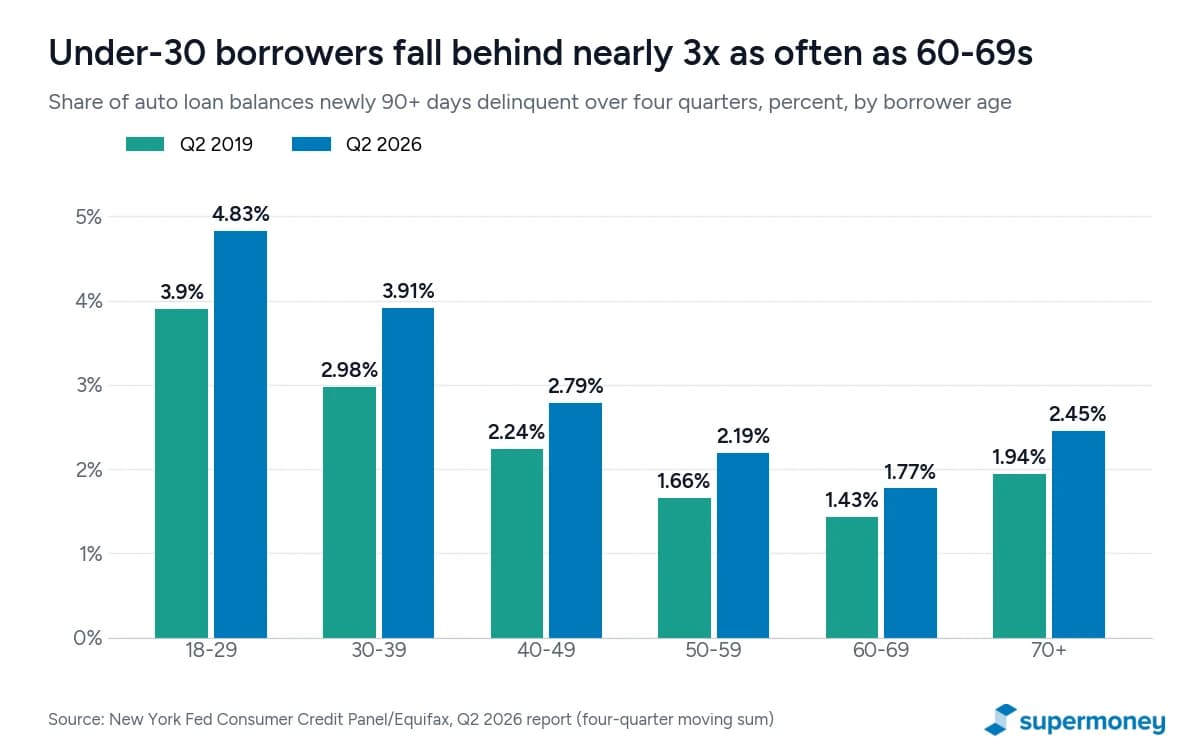
- 5.49% of auto loan balances are 90 or more days late, just below the Q1 2026 record of 5.60% and the highest since 2010. Borrowers aged 18 to 29 slide into serious delinquency at 4.84% a year, nearly three times the 1.77% rate for ages 60 to 69 (New York Fed).
- 29.1% of new-car trade-ins are underwater, by a record average of $7,107. Those buyers finance $57,235 and pay $952 a month (Edmunds, Q3 2026).
- Subprime borrowers took 17.6% of 2026 originations, and subprime originations grew 9.8% year over year, the fastest of any credit tier (Equifax, TransUnion).
- Hybrids are now 16.8% of new-vehicle financing and EVs 8.15%. A hybrid buyer’s average payment is $75 a month lower than a gas buyer’s (Experian).
- Refinancing cut the average borrower’s rate from 10.40% to 7.97% and saved $83 a month. Credit unions did 63% of refinances and delivered the biggest savings (Experian).
- 32.1% of American families carry a vehicle loan, down from 34.7% in 2022, and vehicle ownership in the lowest-income fifth of families fell to 59.4% (Federal Reserve Survey of Consumer Finances, 2025).
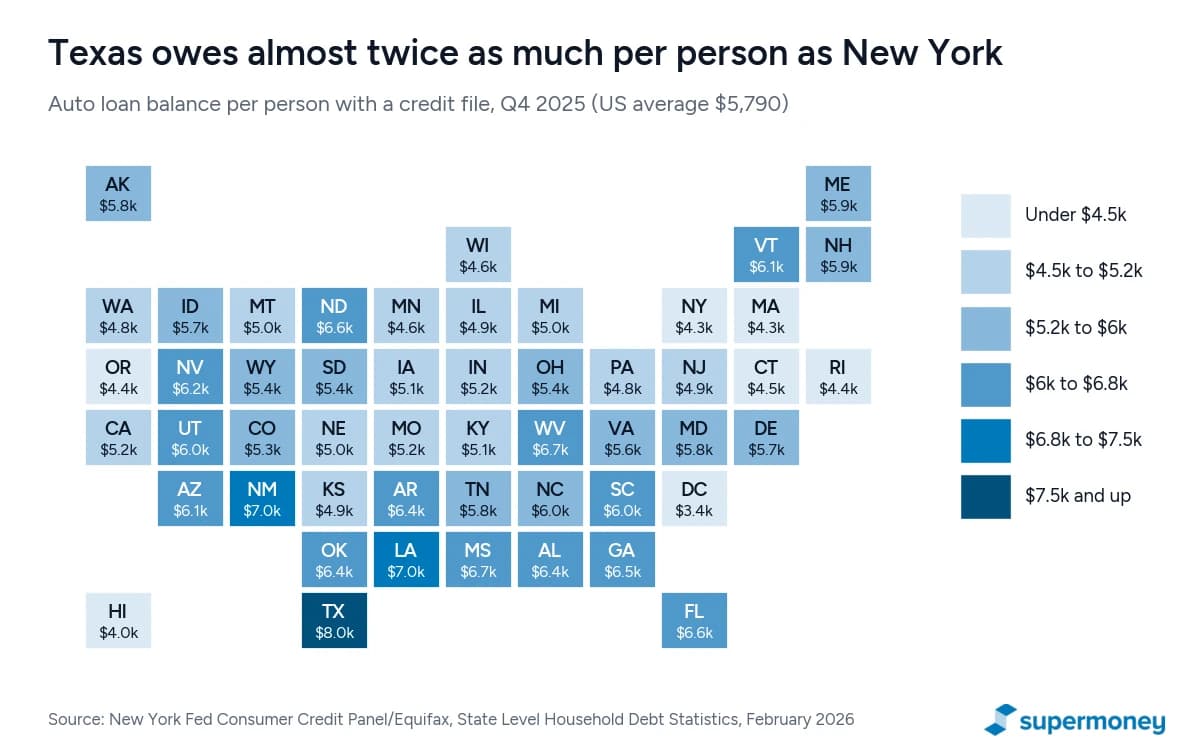
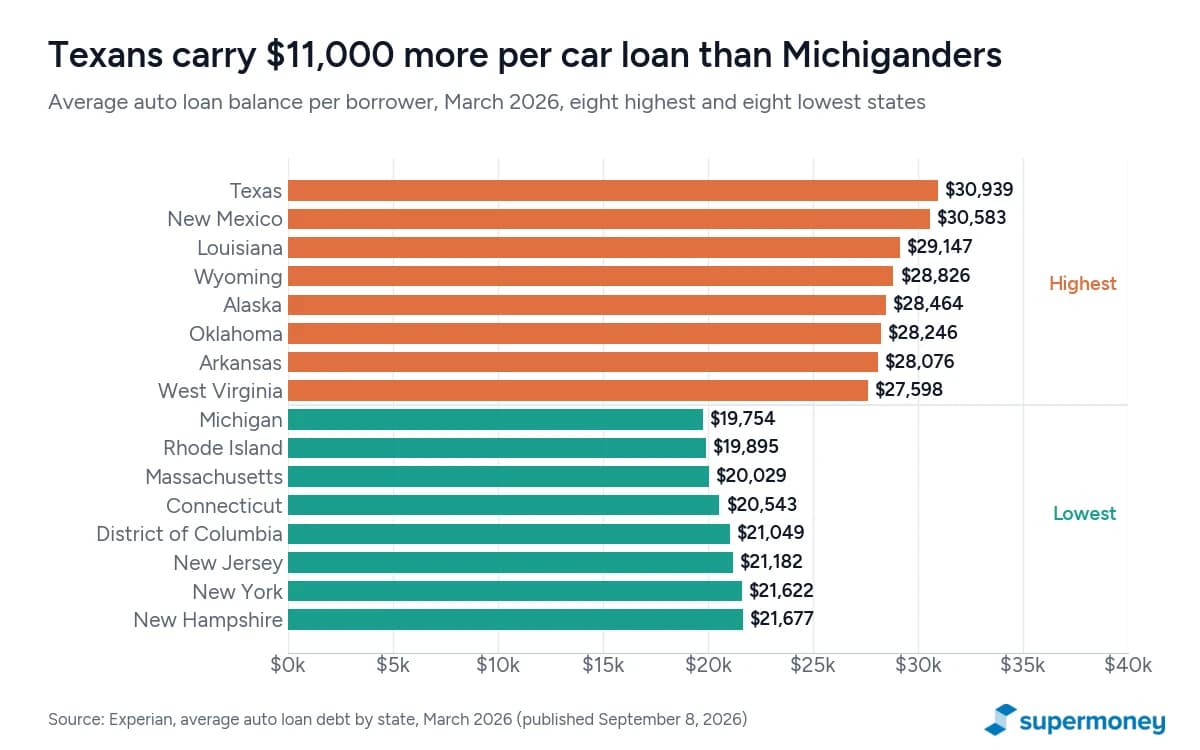
- Where you live matters. Texans owe $8,000 per person in auto debt and $30,939 per loan; New Yorkers owe $4,320 per person and Michiganders $19,754 per loan. Vermont has the lowest serious delinquency in the country at 2.84% and the District of Columbia the highest at 13.58%.
How much auto loan debt Americans owe
Americans owed $1.713 trillion on auto loans and leases at the end of June 2026, according to the Federal Reserve Bank of New York’s Consumer Credit Panel, which is built from Equifax credit files. Balances rose $28 billion in the second quarter and $58 billion over the year. Auto loans are the second-largest slice of household debt after mortgages ($13.1 trillion), just ahead of student loans ($1.65 trillion), and they have more than doubled since 2010, when the total bottomed out near $700 billion.
You’ll see several totals quoted for auto debt, and they’re all right for what they measure. The New York Fed counts loans and leases on consumer credit reports. The Federal Reserve’s G.19 release counts motor vehicle loans held by lenders and excludes leases, which is why it reports a smaller $1.575 trillion for the same quarter. Experian and TransUnion count from their own bureau files and land at $1.574 trillion and $1.65 trillion. Equifax, which also folds in leases, reports $1.7 trillion as of August 2026. The table below shows the differences so you can compare like with like.
| Source | What it counts | Latest figure | As of |
|---|---|---|---|
| New York Fed / Equifax | Auto loans and leases on credit reports | $1.713 trillion | Q2 2026 |
| Equifax Market Pulse | Auto loans and leases, 87.3 million accounts | $1.7 trillion | August 2026 |
| TransUnion | Auto loans, 79.4 million accounts | $1.65 trillion | Q3 2026 |
| Federal Reserve G.19 | Motor vehicle loans held by lenders, no leases | $1.575 trillion | Q2 2026 |
| Experian | Auto loan balances, consumer-level | $1.574 trillion | March 2026 |
The growth is slower than it looks from the headline. The G.19 series has been flat at roughly $1.56 trillion to $1.57 trillion since the end of 2023. What’s changing is the mix. Fewer people hold a car loan, but the ones who do owe more. The average balance per borrower is $24,909 according to Experian (March 2026) and $25,525 according to TransUnion (Q3 2026), both up about 2% to 3% in a year.
Who has a car loan
The Federal Reserve’s 2025 Survey of Consumer Finances, published in October 2026, found that 32.1% of American families carry a vehicle loan, down from 34.7% in 2022. The typical family with a loan owes $17,000 (the median), while the average is $23,100 because a minority of large loans pulls the mean up. Vehicle ownership itself slipped from 86.6% to 84.2% of families, and almost all of that decline came from the lowest-income fifth, where ownership fell from 66.4% to 59.4%, the lowest the survey has recorded for that group in recent history.
That matters because a car is still how most Americans get to work. The Census Bureau’s 2025 American Community Survey counts 8.8% of households with no vehicle at all, up from 8.5% a year earlier. Capital One’s September 2026 Mobility Access Study estimated that gaining access to a vehicle lifts annual earnings by about $21,000, and found that 58% of adults who want a car aren’t confident they can afford one.
Another reason fewer families are borrowing is that cars are lasting longer. The average light vehicle on U.S. roads was 12.8 years old in 2025, a record, according to S&P Global Mobility. When your car keeps running, you don’t take out a new loan.
Financing is still the default for new cars. Experian reports that 83.3% of new-vehicle buyers financed in Q2 2026, and 37.4% of used-vehicle buyers did. Leases took 23.75% of new-vehicle transactions, with an average lease payment of $617 a month, $148 below the average new-car loan payment.
Average car payment in 2026
The average new-car payment is $787 a month and the average used-car payment is $582, according to Edmunds’ Q3 2026 data. Experian’s Q2 2026 figures are a little lower at $765 and $542, and TransUnion’s third-quarter numbers (through August) are $788 and $551. J.D. Power, which tracks dealer transactions in real time, put the average new-vehicle finance payment at a record $823 in October 2026. The sources differ because they sample different deals, but they all point the same way: up, by $20 to $30 a month over the past year.
| Measure (new vehicles) | Q3 2025 | Q2 2026 | Q3 2026 |
|---|---|---|---|
| Average amount financed | $42,744 | $44,156 | $44,664 |
| Average monthly payment | $756 | $777 | $787 |
| Average APR | 7.0% | 7.0% | 7.0% |
| Average term | 70.0 months | 70.4 months | 70.5 months |
| Share with 84+ month loans | 21.8% | 23.9% | 25.5% |
| Share paying $1,000+ a month | 19.1% | 20.3% | 21.2% |
| Average down payment | $6,021 | $5,815 | $5,554 |
| Total interest over the loan | $9,442 | $9,811 | $9,938 |
Source: Edmunds, Q3 2026 auto finance data.
Used-car buyers finance less but pay more for the money. Edmunds puts the average used loan at $30,703 over 70.4 months at 10.6% APR, for a $582 payment. Only 6.5% of used-car buyers pay $1,000 or more a month, versus 21.2% of new-car buyers.
The $1,000-a-month car payment used to be a punchline. It is now a fifth of the new-car market, and the buyers who sign one are stretching the term to get there: 69% of them chose loans of 72 months or longer, according to Edmunds.
Payments by credit score
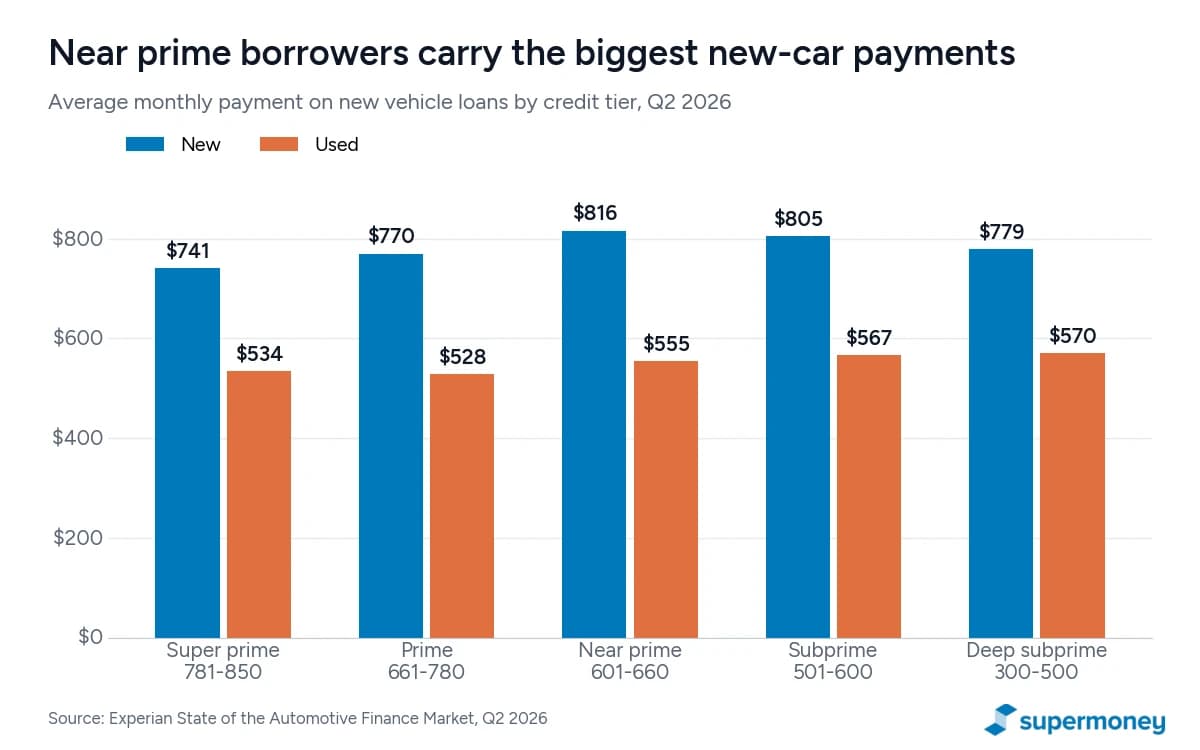
Here’s a pattern that surprises most readers: the highest payments don’t belong to the best or the worst credit scores. Near prime borrowers (scores of 601 to 660) have the biggest new-car payment at $816 a month, because they borrow almost as much as prime borrowers but at a 9.71% rate. Super prime borrowers pay $741 on the largest loans in the market because their 4.41% rate keeps the payment down.
How much of your income goes to the car
Cox Automotive and Moody’s Analytics track affordability as the number of weeks of median household income needed to buy the average new vehicle. In September 2026 that figure was 35.7 weeks, the least affordable reading since January and only a touch better than a year ago. Their estimate of the typical payment, $776, is the highest since December 2023.
Borrowers feel it. In a May 2026 survey of 2,000 car-loan holders by Caribou, an auto refinance lender, 30% had struggled to make a payment on time in the past 12 months, 22% said their payment is difficult to afford, and 44% said they felt pressured during the financing process.
A good rule: keep your car payment under 10% of your take-home pay, and total car costs (payment, insurance, fuel, maintenance) under 20%. On a $60,000 salary that’s roughly $400 a month for the payment. At the current $787 average, a new-car buyer needs about $94,000 a year in take-home pay to stay inside that line, which tells you how far the market has drifted from what most households can carry.
Average auto loan interest rates by credit score
The average APR was 6.35% on new vehicles and 11.19% on used in Q2 2026, both down about 40 basis points from a year earlier, according to Experian. Your credit score decides where you land in that range more than anything else, including which lender you pick.
| Credit tier (VantageScore) | New APR | Used APR | New loan | New payment | New term |
|---|---|---|---|---|---|
| Super prime (781-850) | 4.41% | 6.29% | $41,667 | $741 | 64.9 mo |
| Prime (661-780) | 6.15% | 8.81% | $45,958 | $770 | 72.4 mo |
| Near prime (601-660) | 9.71% | 13.93% | $46,079 | $816 | 75.6 mo |
| Subprime (501-600) | 13.52% | 19.10% | $41,019 | $805 | 74.9 mo |
| Deep subprime (300-500) | 16.11% | 21.62% | $36,713 | $779 | 73.7 mo |
Source: Experian State of the Automotive Finance Market, Q2 2026.
What those rates cost in dollars: on a $30,000 new-car loan over 72 months, a super prime borrower pays $475 a month and $4,199 in total interest. A near prime borrower pays $551 a month and $9,701 in interest. A deep subprime borrower pays $653 a month and $16,985 in interest, four times the super prime cost for the same car. On a $30,000 used-car loan the deep subprime borrower pays $23,786 in interest, nearly 80% of the price of the car.
Rates at banks are higher than the blended average because the average includes captive lenders’ subsidized deals. The Federal Reserve’s G.19 release put the average commercial bank rate on a 60-month new-car loan at 7.54% in August 2026 and 7.17% on 72-month loans. Bankrate’s weekly survey of the ten largest banks showed 7.06% on 60-month new loans and 7.47% on 48-month used loans as of November 4, 2026. Finance companies, which include the captive arms of automakers, averaged 6.3% on new-car loans in Q2 2026.
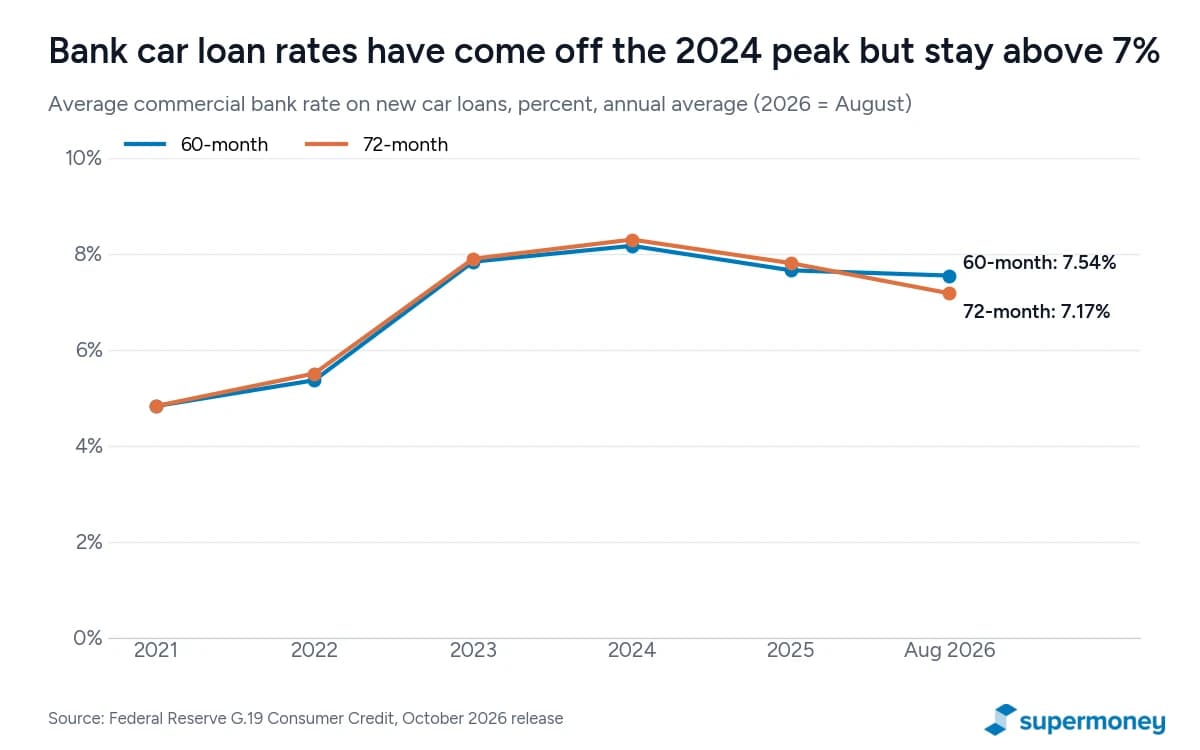
Longer loans no longer cost more per year. Bankrate’s survey shows 48-month loans only 16 basis points cheaper than 60-month loans, and the Fed’s data shows 72-month bank loans now priced below 60-month loans. That isn’t generosity. Lenders price long loans to win the deal and make it back on the extra years of interest.
Loan terms: the 84-month creep
The average new-car loan runs 69.5 months and the average used-car loan 67.9 months, according to Experian. Those averages hide a fast-growing tail. Edmunds counts 25.5% of new-car loans at 84 months or longer, a record. Cox Automotive’s Dealertrack data shows loans over 72 months at a record 31.8% of financed deals in September 2026, up almost 5 points in a year. Experian’s preliminary third-quarter figures, presented at its November symposium, put 73-to-84-month loans at about 31% of both new and used financing, and the company noted that some lenders are now writing 97-month loans.
Terms get longer as credit gets weaker. Super prime borrowers average 64.9 months on new cars. Every other tier averages 72 to 76 months. Near prime borrowers sign the longest loans in the market at 75.6 months, which is the only way to keep a $46,000 loan at 9.71% under $820 a month.
The cost of stretching is easy to see. On the average $44,664 new-car loan at 7.0% APR, a 60-month loan costs $884 a month and $8,400 in interest. Going to 72 months drops the payment to $761 but raises the interest to $10,162. Going to 84 months drops the payment to $674 and raises the interest to $11,960, a 42% increase over the five-year loan. You’ll also spend the first three to four years owing more than the car is worth, which is where the next section starts.
Negative equity: how many buyers are underwater
Negative equity means you owe more on your loan than the car is worth. In Q3 2026, 29.1% of new-car purchases that involved a trade-in had negative equity on the old car, and the average shortfall hit a record $7,107, according to Edmunds. A year earlier the figures were 28.1% and $6,905.
Buyers who roll that shortfall into the next loan pay for it twice. Edmunds found they financed $57,235 on average, about $12,600 more than the typical new-car buyer, and pay $952 a month at 8.1% APR. Nine in ten of them (91.2%) signed loans of 72 months or longer, and their estimated lifetime interest of $16,610 is $6,700 higher than the average buyer’s.
Cox Automotive’s Dealertrack Credit Availability Index measures the same problem from the lender’s side. The share of financed deals carrying negative equity reached 57.8% in September 2026, up from 52.4% a year earlier. The share of deals with a down payment fell to 12.8%.
The Consumer Financial Protection Bureau’s auto finance data pilot, which examined millions of loans from nine large lenders, showed what negative equity does to a borrower over time. Loans that financed negative equity carried an average payment of $626 against $493 for loans with no trade-in, a loan-to-value ratio of 119%, and were more than twice as likely to be assigned to repossession within two years. The problem is concentrated among buyers of cheaper cars: negative equity equaled 23% to 25% of the purchase price on vehicles under $20,000, versus 10% to 14% on vehicles over $40,000.
What rolling $7,107 of negative equity actually costs: at 8.1% over 72 months, that balance alone adds $125 a month and $1,890 in interest, and it means the new car starts life even deeper underwater than the last one did. If you’re in this position, read our guide on how to get out of a car loan you can’t afford before you trade in.
Loan size and vehicle prices
Loans are bigger because cars are more expensive. Kelley Blue Book’s average new-vehicle transaction price was $50,562 in September 2026, within $52 of the December 2025 record, with average incentives around $3,359. Cox Automotive’s average used-vehicle listing price was $27,235, up 7% in a year, and the supply of used cars under $15,000 has shrunk to about 15% of inventory. Wholesale prices, measured by the Manheim index, were essentially flat year over year at 205.9.
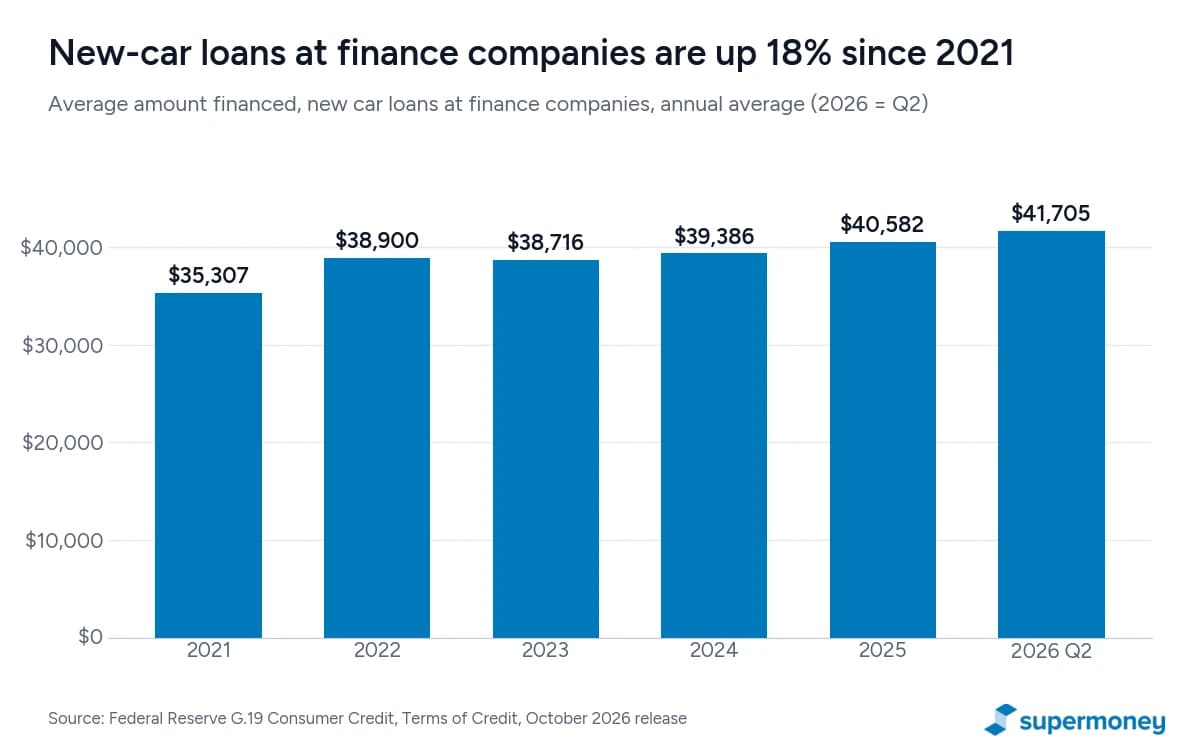
The Federal Reserve’s own measure of loan size, the average amount financed on new-car loans at finance companies, reached $41,705 in Q2 2026, up 18% from $35,307 in 2021. TransUnion reports $44,503 for new and $28,026 for used vehicles through August 2026, both up about 3.5% to 4% from a year earlier.
Down payments are moving the wrong way. The average new-car down payment fell to $5,554 in Q3 2026 from $6,021 a year earlier, according to Edmunds, even as prices rose. A smaller down payment on a bigger loan over a longer term is the recipe for negative equity described above.
Originations: who is getting loans in 2026
Lenders wrote $210.8 billion in new auto loans and leases in Q2 2026, the strongest quarter since 2021, according to the New York Fed. TransUnion counted 6.8 million originations in the quarter, up 2.3% from a year earlier. Equifax tallied 12.8 million loans and leases worth $401.1 billion in the first half of 2026, with dollar volume up 3.5% even though unit volume slipped 1.9%. The CFPB’s auto loan dashboard shows 2.5 million loans and $78.8 billion originated in March 2026 alone.
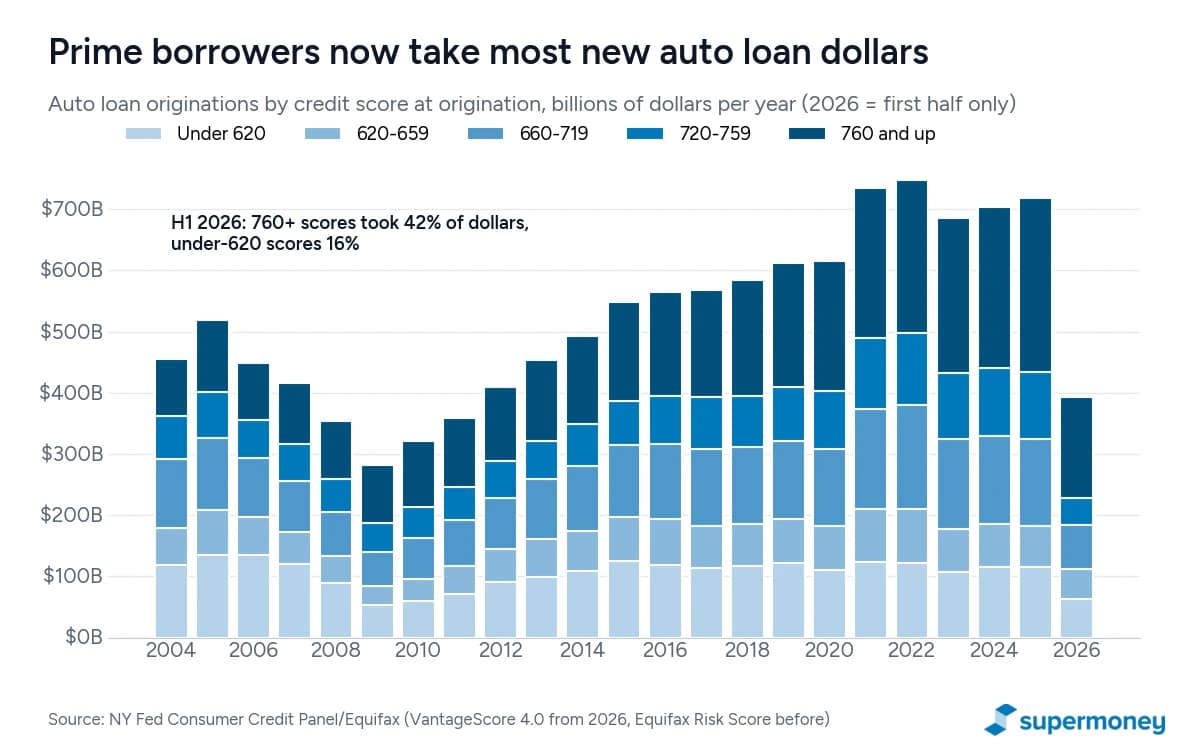
The quality of new lending is good at the top and getting riskier at the bottom. Borrowers with scores of 760 or higher took $86.1 billion of the quarter’s $210.8 billion, or 41%. Borrowers under 620 took $34.0 billion, or 16%. The median credit score on a new auto loan fell seven points in the quarter to 716, and the tenth-percentile borrower had a score of 580.
By age, people in their 40s borrowed the most ($49.8 billion) in Q2 2026, people under 30 borrowed $31.7 billion, and people 70 and older $16.0 billion, according to the New York Fed. Borrowers under 30 also fall behind at the highest rate, which we cover below.
Credit is loosening. Cox Automotive’s Dealertrack Credit Availability Index rose for a fifth straight month in September 2026 to 107.1, its highest reading since April 2015. The approval rate hit 73.9% and the yield spread, which measures how much lenders charge above their funding cost, narrowed by a full percentage point in a year.
Subprime auto loans in 2026
Subprime auto lending is growing faster than any other part of the market. TransUnion reports subprime originations up 9.8% year over year in Q3 2026, the fifth straight quarter in which subprime led all credit tiers. Equifax puts subprime borrowers (VantageScore under 620) at 17.6% of loan originations in the first half of 2026, up 4.5% in relative terms from a year earlier, and 20.3% of outstanding auto debt. Cox Automotive’s subprime share of approved deals rose to 17.4% in September 2026 from 15.1% a year earlier.
Different sources define subprime differently, so don’t mix them. Experian calls scores from 501 to 600 subprime and 300 to 500 deep subprime, and on that basis subprime was 15.75% of total financing in Q1 2026, with deep subprime at 1.3%. Equifax uses under 620 and includes deep subprime in it. The New York Fed’s under-620 bucket was 16.1% of Q2 2026 origination dollars.
Where subprime borrowers get their loans tells you a lot about the risk. According to Equifax, 79.8% of buy-here-pay-here dealer financing and 62.8% of monoline (non-bank, non-captive) finance company debt is subprime, versus 19.3% at banks, 16.9% at captives and 15.8% at credit unions. The Philadelphia Fed’s April 2026 report found that non-captive finance companies hold about 40% of all subprime auto accounts but only 11% of prime accounts.
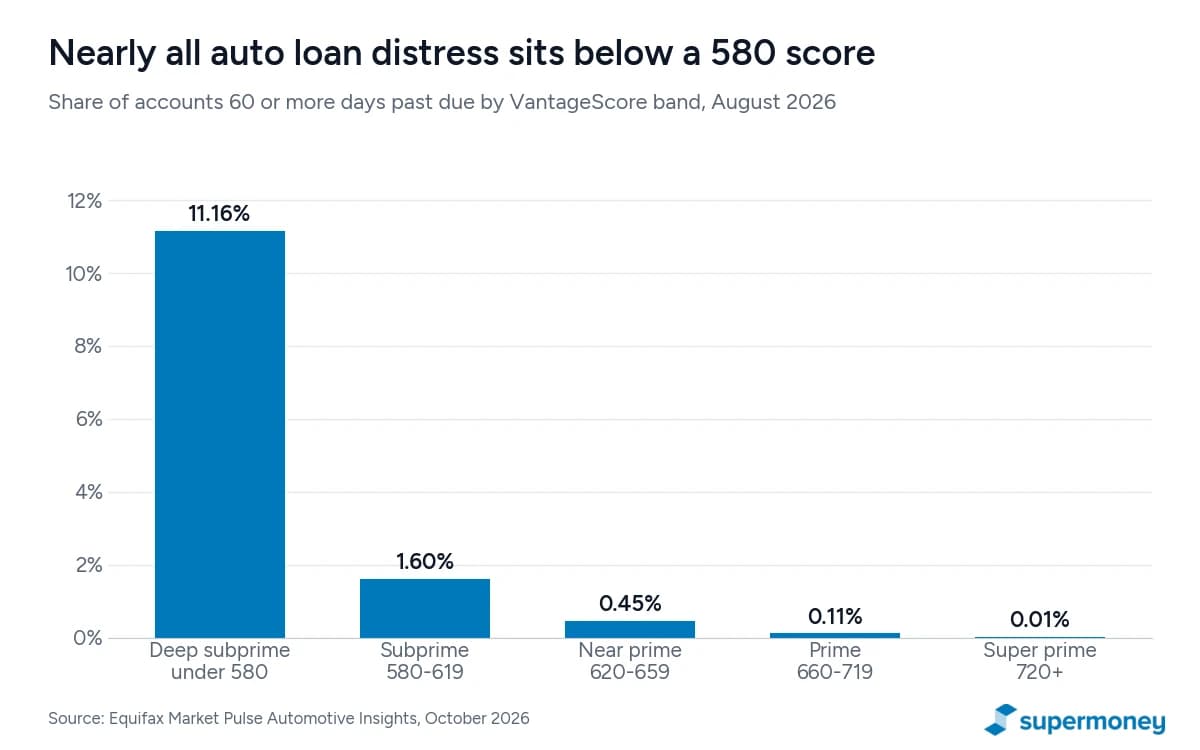
The performance gap is wide. Equifax’s vintage data shows that of the loans originated in Q2 2024, 30.6% of deep subprime loans and 19.3% of subprime loans were 60 or more days past due within two years, compared with 1.3% of super prime loans. Fitch Ratings’ index of subprime auto loans packaged into securities hit a record 6.90% 60-day delinquency in January 2026, the highest reading in the index’s history, and stayed near 6% through the summer, according to industry reports.
If your score is under 620, you’ll pay 13% to 22% at a dealer. Two things cut that cost more than anything else: getting pre-qualified with a lender that specializes in your credit tier before you walk into the dealership, and refinancing after 12 months of on-time payments once your score recovers. Our comparison of auto loan lenders lets you filter by credit score, and our guide to the credit score you need to buy a car explains how each tier is priced.
Delinquencies, defaults and repossessions
Auto loan delinquency is at its highest level since the aftermath of the 2008 recession, and it has stopped getting worse. The share of auto loan balances 90 or more days late was 5.49% in Q2 2026, according to the New York Fed, just under the Q1 record of 5.60% and up from 4.43% two years earlier. For comparison, 12.9% of credit card balances and 1.0% of mortgage balances were seriously delinquent.
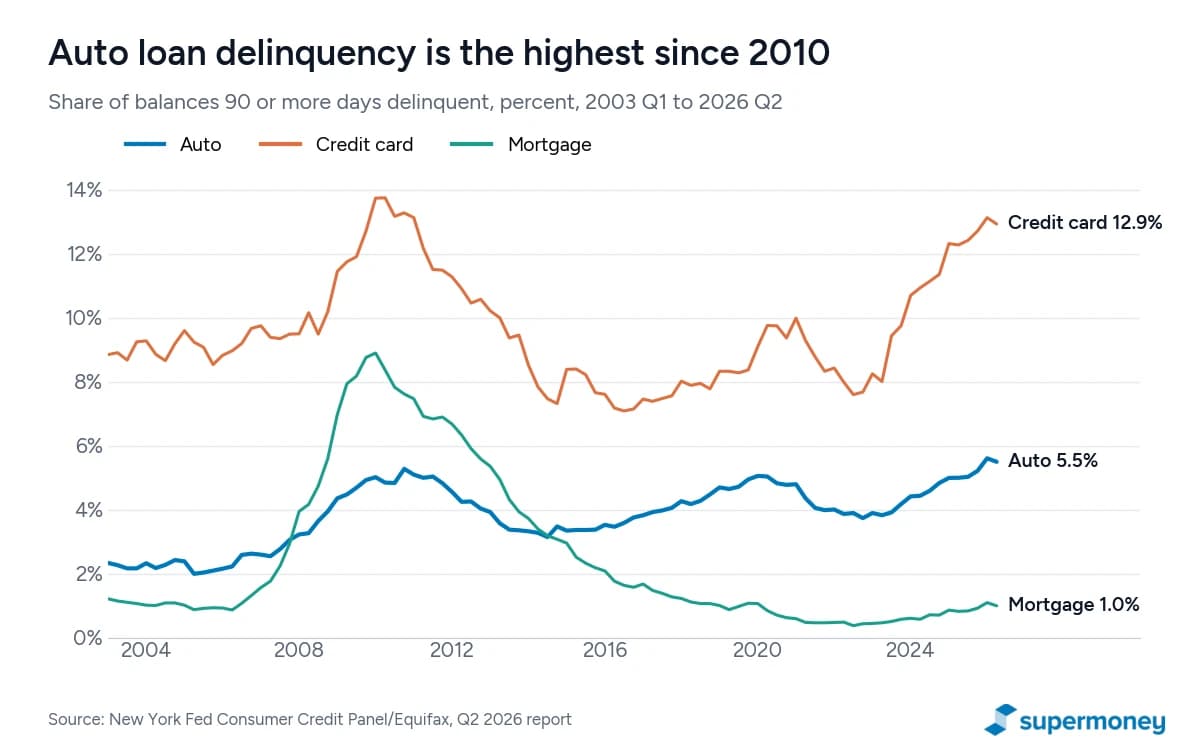
The flow of new problem loans is steadier than the stock. The New York Fed’s transition rate, the share of auto balances that became seriously delinquent over the past four quarters, was 3.00% in Q2 2026, versus 2.93% a year earlier and 2.88% two years earlier. The 30-day transition rate was 7.87%. Both are elevated but flat, which is why the Philadelphia Fed concluded in April 2026 that the rising stock of severe delinquencies reflects longer workout timelines more than a wave of new distress. The Philadelphia Fed also found that the share of auto loans 60 or more days past due peaked at 1.68% in Q3 2025, the highest since 2008, and that subprime borrowers hold 17% of active accounts but nearly two-thirds of delinquent ones.
Bureau-level measures tell the same story in smaller numbers, because they count accounts rather than dollars. TransUnion’s 60-day delinquency rate was 1.64% in Q3 2026, down one basis point from a year earlier. Equifax’s was 1.7% of accounts in August 2026, down 11% in relative terms. Experian’s 30-day rate was 2.39% and its 60-day rate 0.90% in Q2 2026, both slightly higher than a year earlier.
Younger borrowers are struggling the most
Borrowers aged 18 to 29 moved into serious delinquency at a rate of 4.84% in the year to Q2 2026, versus 3.91% for 30-somethings, 2.79% for 40-somethings and 1.77% for people aged 60 to 69. Every age group is worse off than before the pandemic. In Q2 2019 the under-30 rate was 3.90% and the 60-to-69 rate 1.43%.
Repossessions
The CFPB’s repossession report, built from the same lender data pilot, found that 0.75% of open auto accounts were assigned for repossession in December 2022, up 22.5% from 0.61% in December 2019, and that subprime assignments reached 1.7% of accounts. Deep subprime borrowers accounted for 39% of completed repossessions and super prime borrowers for 6%. Lenders increasingly outsource the job to repossession forwarders (66% of assignments by the end of 2022, up from 31% in 2018), which raises the fees charged to the borrower. About 30% of borrowers redeemed their vehicle after it was repossessed.
Complaints track the trend. The CFPB received about 28,500 vehicle loan and lease complaints in 2025, with repossession the most common issue, and loan-related complaint volume ran 56% above the average of the prior two years. If you’re behind, our guide on how many car payments you can miss before repossession explains your options at each stage.
EV and hybrid financing
Hybrids are winning the finance office. They were 16.80% of new-vehicle financing in Q2 2026, up from 12.99% a year earlier, according to Experian. Electric vehicles slipped to 8.15% from 9.21%. J.D. Power’s October 2026 retail data shows the same shape: hybrids at 18.6% of sales and EVs at 6.9%.
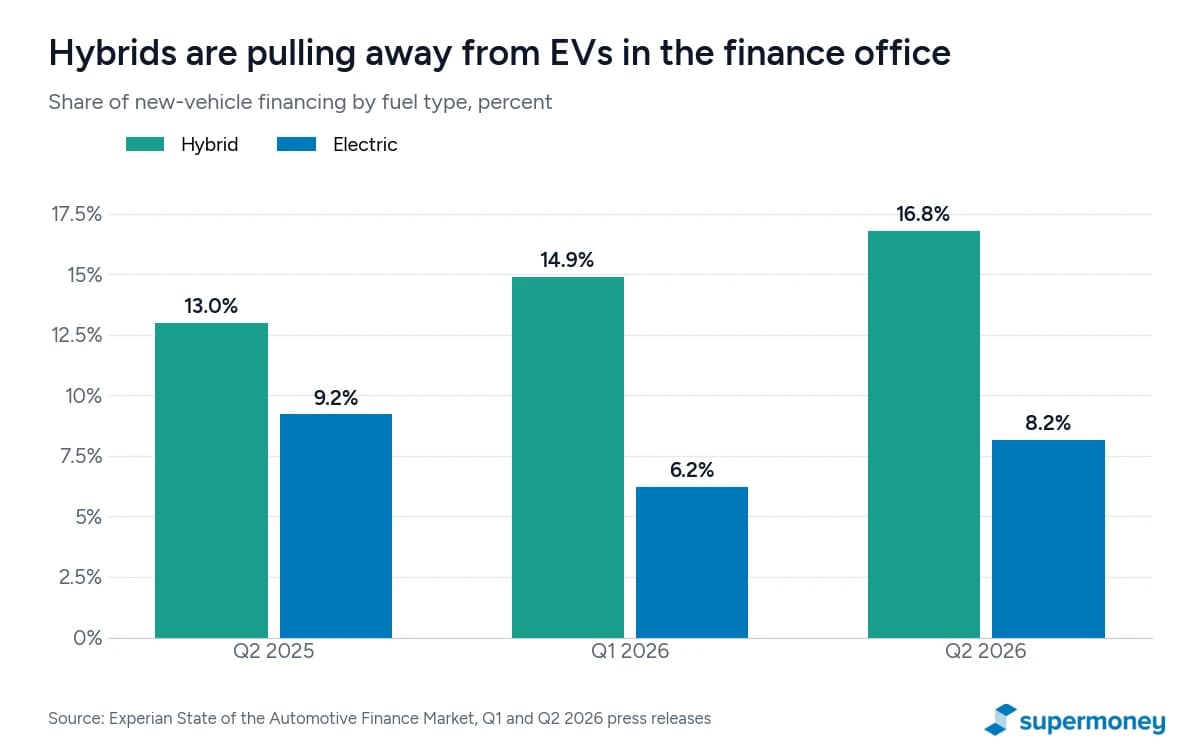
Part of the reason is the payment. The average monthly payment on a new hybrid loan was $646 in Q2 2026, versus $692 for an EV and $721 for a gas vehicle. The federal EV tax credit ended on September 30, 2025, and Cox Automotive lowered its 2026 lease-penetration forecast to 23% as a result, since leasing had been the main route to that credit.
Used EVs are a different story. An Edmunds and TransUnion analysis found the average amount financed on a used EV was 18.8% lower than in Q2 2023, as resale values fell. Among Tesla owners trading in at franchised dealers, the share buying another EV dropped from 40.2% to 22%, and one in five switched to a hybrid. If you’re financing a used EV, that depreciation is why lenders may offer a shorter term or ask for more money down.
Who lends: market share by lender type
Banks still hold the largest share of vehicle financing at 27.15%, but captive lenders (the financing arms of automakers, such as Toyota Financial Services and GM Financial) are right behind at 26.26%, and credit unions have climbed to 20.38%, according to Experian’s Q2 2026 data. A year of quarterly readings shows banks and captives giving up about a point each while credit unions gained.
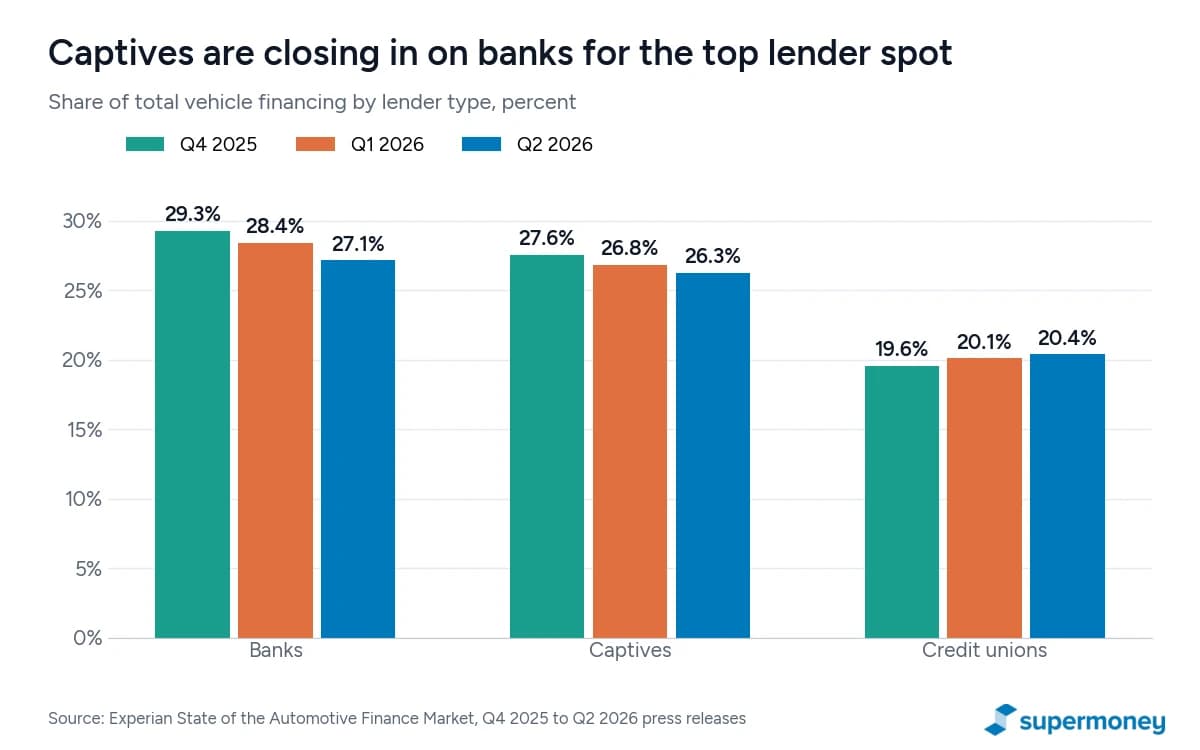
Equifax’s balance data adds the rest of the picture. As of August 2026, banks held $570.0 billion in auto debt, captives $523.9 billion, credit unions $498.6 billion (up 7.0% in a year, the fastest-growing major lender type), monoline finance companies $78.3 billion and buy-here-pay-here dealers $10.5 billion. Experian’s symposium data showed the top 25 lenders control about 60% of the market and are slowly losing share to finance companies.
| Lender type | Auto debt held | Share that is subprime | 60+ day delinquency | Typical borrower |
|---|---|---|---|---|
| Banks | $570.0B | 19.3% | 1.2% | Prime buyers who arrange financing before the dealership; competitive rates, some fees |
| Captives | $523.9B | 16.9% | 0.8% | New-car buyers; subsidized promotional rates on specific models |
| Credit unions | $498.6B | 15.8% | 0.8% | Members; lowest average rates and the dominant refinance channel |
| Monoline finance companies | $78.3B | 62.8% | 11.0% | Subprime and near prime buyers at franchised dealers |
| Buy-here-pay-here dealers | $10.5B | 79.8% | 7.6% | Deep subprime buyers with no other option; highest rates |
Source: Equifax Market Pulse Automotive Insights, October 2026 (data as of August 2026).
The largest banks in auto lending include Capital One, Ally Financial, JPMorgan Chase, Wells Fargo, Bank of America, U.S. Bank, PNC, Truist, TD Bank, Citizens, Fifth Third and Huntington. The biggest captives are Toyota Financial Services, GM Financial, Ford Credit, American Honda Finance, Hyundai Capital, Nissan Motor Acceptance, Stellantis Financial Services and VW Credit. Among finance companies, Santander Consumer, Credit Acceptance, Westlake Financial, Exeter Finance, World Omni and Regional Acceptance are the largest. Credit unions compete through networks such as CU Direct (Origence), which connects more than a thousand credit unions to dealerships, and through large individual lenders such as Navy Federal, PenFed, Alliant and Golden 1.
The gap between lender types shows up in the price. The Federal Reserve’s data has bank 60-month rates at 7.54% while finance-company new-car rates (which include captives) average 6.3%. Credit unions typically undercut both. That’s why a credit union is the first place to check if you’re refinancing.
Auto loans by state
National averages hide enormous differences. A Texan with a car loan owes $30,939 on average, a Michigander $19,754. Auto debt per person with a credit file runs from $8,000 in Texas to $3,350 in the District of Columbia. Serious delinquency runs from 2.84% of balances in Vermont to 13.58% in DC. The table below combines the best state-level sources into one place: Experian’s average balance per borrower, the New York Fed’s auto debt per capita and 90-day delinquency rate, the average APR and share of seven-year-plus loans on loans opened in Q4 2025 (from the University of California Consumer Credit Panel, published by Protect Borrowers and The Century Foundation), Edmunds’ average new and used payments, and Insurify’s average full-coverage insurance premium.
| State | Avg. balance per borrower | Auto debt per person | 90+ days late | New-loan APR | New-car payment | Used-car payment | 7+ year loans |
|---|---|---|---|---|---|---|---|
| Alabama | $26,938 | $6,370 | 6.55% | 10.7% | $777 | $592 | 13.8% |
| Alaska | $28,464 | $5,790 | 2.94% | 8.8% | $854 | $632 | 39.4% |
| Arizona | $27,206 | $6,130 | 5.56% | 10.7% | $755 | $581 | 20.6% |
| Arkansas | $28,076 | $6,420 | 5.61% | 9.8% | $755 | $578 | 15.1% |
| California | $24,895 | $5,210 | 4.84% | 9.9% | $740 | $597 | 13.5% |
| Colorado | $24,140 | $5,340 | 4.01% | 9.3% | $766 | $565 | 13.4% |
| Connecticut | $20,543 | $4,460 | 3.06% | 9.0% | $659 | $541 | 7.7% |
| Delaware | $23,839 | $5,650 | 6.12% | 9.8% | $727 | $588 | 20.0% |
| District of Columbia | $21,049 | $3,350 | 13.58% | 12.0% | n/a | n/a | 13.2% |
| Florida | $26,316 | $6,570 | 5.53% | 10.0% | $734 | $588 | 18.2% |
| Georgia | $27,014 | $6,490 | 6.99% | 11.6% | $798 | $641 | 13.5% |
| Hawaii | $24,633 | $3,990 | 3.67% | 9.1% | $754 | $600 | 8.5% |
| Idaho | $25,976 | $5,670 | 3.27% | 8.8% | $746 | $565 | 19.9% |
| Illinois | $23,424 | $4,880 | 5.59% | 10.1% | $733 | $575 | 9.5% |
| Indiana | $22,842 | $5,220 | 6.26% | 10.6% | $713 | $535 | 11.3% |
| Iowa | $23,401 | $5,130 | 3.53% | 9.3% | $661 | $515 | 12.8% |
| Kansas | $24,795 | $4,930 | 4.04% | 9.4% | $759 | $553 | 11.2% |
| Kentucky | $24,580 | $5,080 | 4.92% | 10.5% | $728 | $547 | 14.8% |
| Louisiana | $29,147 | $7,000 | 6.55% | 10.4% | $814 | $613 | 18.3% |
| Maine | $22,743 | $5,860 | 3.09% | 7.5% | $682 | $538 | 19.4% |
| Maryland | $24,875 | $5,850 | 6.00% | 9.9% | $739 | $582 | 13.8% |
| Massachusetts | $20,029 | $4,310 | 2.59% | 8.7% | $628 | $513 | 9.5% |
| Michigan | $19,754 | $4,960 | 6.25% | 9.5% | $606 | $488 | 17.1% |
| Minnesota | $21,802 | $4,570 | 3.03% | 8.3% | $690 | $527 | 9.5% |
| Mississippi | $27,166 | $6,680 | 7.68% | 11.8% | $797 | $621 | 12.6% |
| Missouri | $23,805 | $5,150 | 5.55% | 10.0% | $730 | $544 | 11.7% |
| Montana | $24,689 | $4,990 | 4.02% | 9.4% | $730 | $527 | 12.6% |
| Nebraska | $22,816 | $4,960 | 3.25% | 9.2% | $693 | $495 | 12.2% |
| Nevada | $27,320 | $6,230 | 6.16% | 10.9% | $791 | $612 | 14.8% |
| New Hampshire | $21,677 | $5,930 | 3.02% | 8.7% | $646 | $495 | 14.2% |
| New Jersey | $21,182 | $4,860 | 4.23% | 10.4% | $653 | $560 | 10.2% |
| New Mexico | $30,583 | $7,000 | 6.07% | 10.3% | $788 | $626 | 23.6% |
| New York | $21,622 | $4,320 | 4.27% | 9.2% | $648 | $558 | 14.8% |
| North Carolina | $24,951 | $5,980 | 6.06% | 10.7% | $742 | $590 | 15.6% |
| North Dakota | $26,084 | $6,640 | 2.92% | 7.6% | $749 | $546 | 6.1% |
| Ohio | $21,880 | $5,410 | 5.34% | 10.7% | $663 | $511 | 14.7% |
| Oklahoma | $28,246 | $6,370 | 5.48% | 9.7% | $783 | $588 | 18.9% |
| Oregon | $22,989 | $4,360 | 3.59% | 8.7% | $699 | $506 | 23.9% |
| Pennsylvania | $21,878 | $4,850 | 4.79% | 9.5% | $656 | $519 | 14.8% |
| Rhode Island | $19,895 | $4,380 | 3.54% | 8.6% | $621 | $505 | 8.5% |
| South Carolina | $25,042 | $6,050 | 6.18% | 10.8% | $730 | $575 | 13.3% |
| South Dakota | $23,738 | $5,370 | 3.65% | 8.3% | $658 | $520 | 7.6% |
| Tennessee | $26,508 | $5,810 | 5.69% | 10.3% | $757 | $562 | 20.2% |
| Texas | $30,939 | $8,000 | 5.76% | 10.3% | $837 | $637 | 13.8% |
| Utah | $24,294 | $6,030 | 2.95% | 8.0% | $771 | $570 | 14.3% |
| Vermont | $22,121 | $6,110 | 2.84% | 7.7% | $646 | $522 | 12.0% |
| Virginia | $24,243 | $5,560 | 4.64% | 9.8% | $739 | $570 | 12.3% |
| Washington | $24,977 | $4,810 | 3.78% | 8.6% | $753 | $555 | 26.0% |
| West Virginia | $27,598 | $6,650 | 5.27% | 10.7% | $727 | $568 | 17.4% |
| Wisconsin | $21,804 | $4,560 | 3.64% | 8.8% | $657 | $530 | 8.3% |
| Wyoming | $28,826 | $5,430 | 3.49% | 8.8% | $852 | $585 | 22.1% |
Sources: Experian (average balance, March 2026); New York Fed Consumer Credit Panel/Equifax (debt per capita and 90+ day delinquency, Q4 2025); Protect Borrowers and The Century Foundation, UC Consumer Credit Panel (new-loan APR and share of 7+ year loans, Q4 2025 originations); Edmunds (new and used payments, through April 2026); Insurify (full-coverage premium, through June 2026). Edmunds does not publish a DC payment figure. Download the full dataset, including secondary delinquency measures and the no-vehicle share of households, as a CSV file.
What the state numbers show
- Texas, New Mexico and Louisiana owe the most per person ($7,000 to $8,000) and pay the same average APR on new loans (10.3% to 10.4%), but their repayment records differ: 7.24% of Texans with an auto or retail loan are 60 or more days late, versus 6.79% in New Mexico and 8.67% in Louisiana, the third-highest rate in the country (Urban Institute). Texas also has the third-highest new-car payment ($837 a month).
- It’s not shocking that Texas tops the debt table. Texans buy bigger vehicles and finance all of them. Pickups are 27% of new-vehicle sales in Texas, versus about 17% in California, and Texas has led the country in total dollars spent on new vehicles since 2024, according to J.D. Power. Texas tax rules also make leasing far more expensive than in most states, so buyers finance the whole truck instead of a few years of its depreciation. Loan terms there run about a month and a half longer than in California, and dealers collect about $2,200 per vehicle in financing and insurance products, $400 more than California dealers do. Bigger vehicles, more loans and longer terms add up to the largest balances in the country.
- North Dakota has the sixth-highest auto debt per person ($6,640) and the second-lowest serious delinquency (2.92%). It also has the fewest seven-year-plus loans in the country (6.1% of new loans) and one of the lowest new-loan APRs (7.6%). Short terms and cheap money produce high balances with almost no distress.
- Vermont has the lowest 90-day delinquency of any state (2.84%) despite one of the highest shares of adults with a car loan (37.7% versus 28.7% nationally, per the Urban Institute). Many borrowers, modest loans ($22,121 on average), paid on time.
- DC is the outlier in both directions. It borrows the least per person because 36.5% of its households own no vehicle, yet it has the highest serious delinquency (13.58%) and the highest average new-loan APR (12.0%). Few people in DC borrow for a car, and those who do are the riskiest borrowers in the dataset.
- Utah and Nevada owe about the same per person ($6,030 versus $6,230), but Nevada’s delinquency is double (6.16% versus 2.95%), its new-loan APR is 2.9 points higher (10.9% versus 8.0%) and its full-coverage insurance costs $1,260 more a year.
- Alaska takes the biggest new loans ($38,030) and the longest terms (39.4% at seven years or more, versus 26.0% in second-place Washington), yet has the third-lowest delinquency (2.94%). Long terms by themselves aren’t predicting distress there.
- Michigan finances the cheapest cars (lowest balance, lowest new-car payment at $606) but pays nearly twice as much as neighboring Ohio to insure it ($2,688 versus $1,404 a year) and has the seventh-highest delinquency (6.25%).
- Maryland pays the most to insure a car ($3,648 a year) and is 29% more likely than Virginia to be 90 days late on an auto loan (6.00% versus 4.64%) at an identical APR.
- West Virginia’s average balance per borrower grew faster than any other state’s over the past year (+4.8%), 28.9% of its adults have debt in collections versus 19.2% in neighboring Virginia, and a $1,000 car payment would eat 18.8% of its median monthly household income.
- Georgia has the highest used-car APR in the country (12.94%, per Edmunds), the fourth-highest insurance bill ($3,108) and the third-highest serious delinquency (6.99%). One in three Georgians has debt in collections.
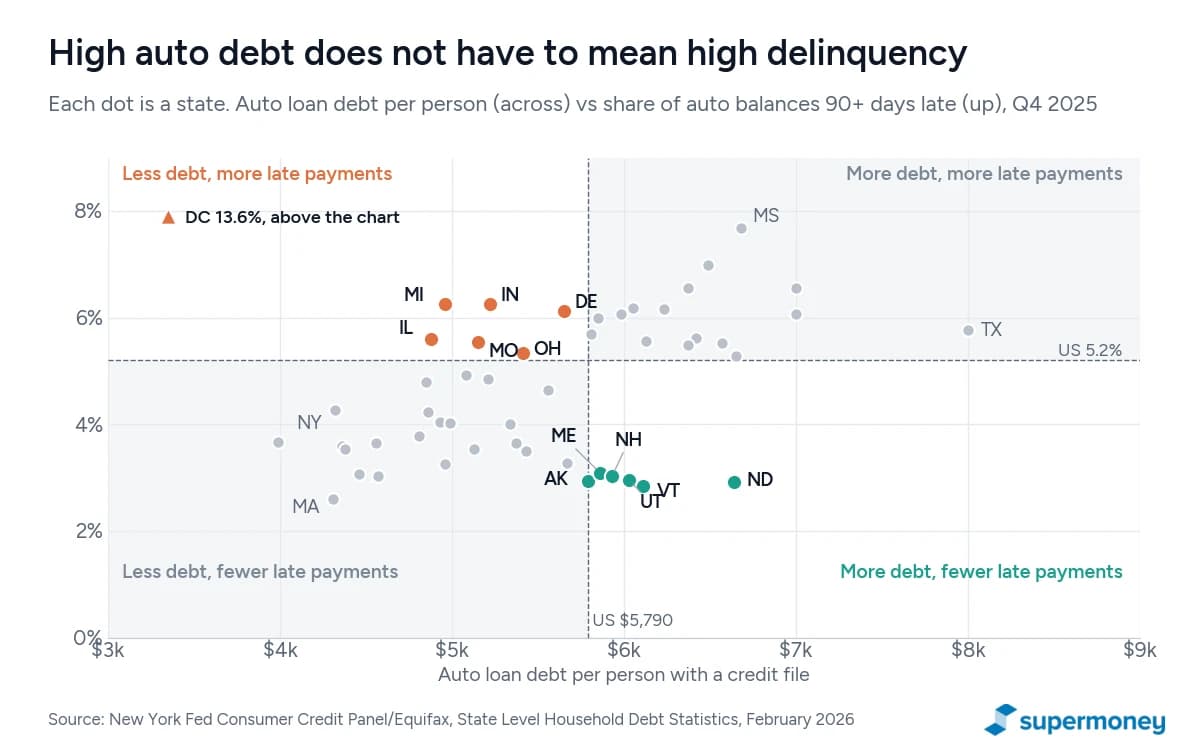
Delinquency rankings move depending on the measure, so pick your source before you compare. The New York Fed figure is the share of dollars 90 or more days late and covers every state and DC, which is why we use it as the headline. The Urban Institute measures the share of people with an auto or retail loan who are 60 or more days late, which weights every borrower equally rather than every dollar. Georgia, for example, ranks third on the New York Fed measure and sixth on the Urban Institute’s.
For a deeper look at the states with the worst repayment records and how to avoid default, see our analysis of auto loan delinquencies by state.
Auto loan refinancing in 2026
Refinancing is the one lever most borrowers never pull, even when the payment hurts. Caribou’s May 2026 survey found that 30% of car-loan holders had struggled to make a payment on time in the past year and 22% called their payment difficult to afford. Borrowers who do refinance wait about 26 months after the original loan was opened, according to Experian, which means two years of paying a rate they could have cut.
The savings are real and consistent across sources. Experian found that borrowers who refinanced in Q2 2026 cut their rate from 10.40% to 7.97% on average and lowered their payment by $83 a month, about 26 months after the original loan was opened. Caribou, a refinance lender, reports $165 a month in Q3 2026 with an average rate cut from 11.23% to 7.34%. The gap between the two figures mostly reflects who refinances through each channel: Caribou’s customers started with higher rates.
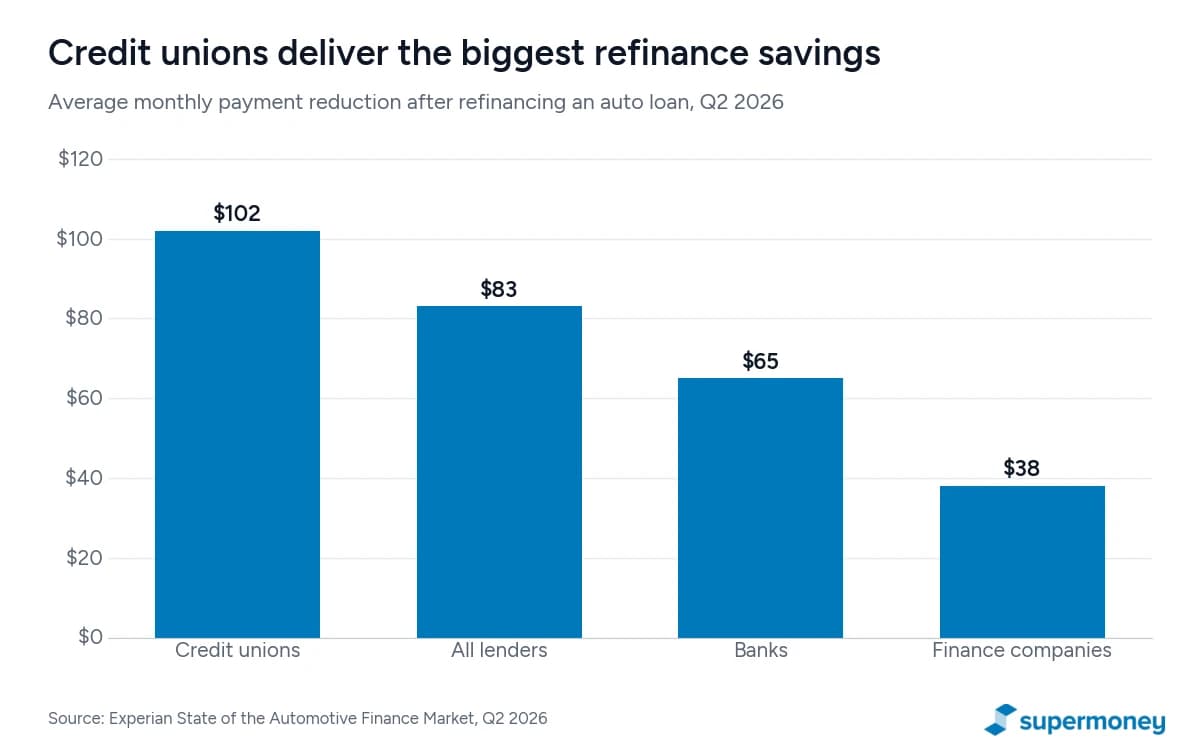
Where you refinance matters as much as whether you do. Credit unions handled 63.4% of refinances in Q1 2026 and delivered the largest savings at $102 a month, versus $65 at banks and $38 at finance companies, according to Experian. That’s consistent with credit unions’ lower average rates across the board.
Refinance rates by credit score
Your score decides most of your refinance rate. On SuperMoney’s marketplace, the rates partner lenders estimated for people who applied to refinance an auto loan between November 2025 and November 2026 ran from a median of 5.69% for applicants with scores of 781 and up to 10.24% for scores of 501 to 600, a gap of more than 4.5 points on the same kind of loan.
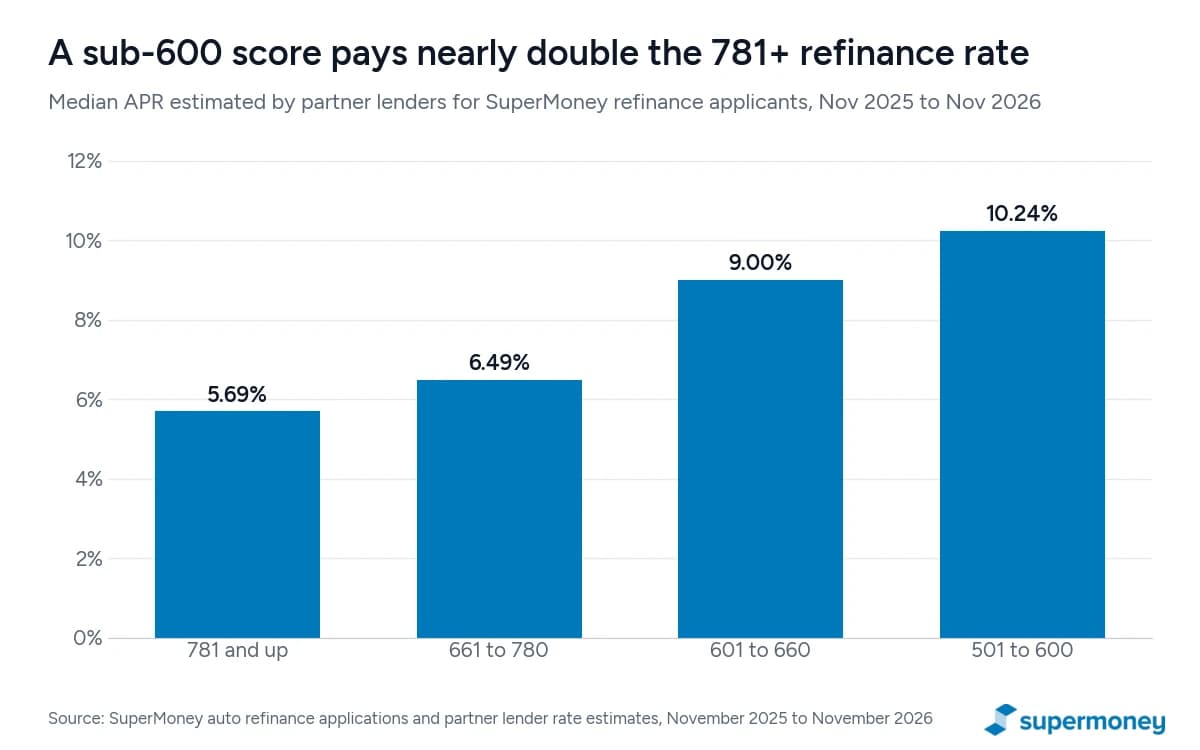
The typical applicant over that period had a current payment of $632 a month, and one in five (20.6%) pays $1,000 or more. The median credit score was 650, the median vehicle was six years old with 53,000 miles, and median household income was $63,000. By credit score, the estimates break down like this:
| Applicant credit score | Median estimated APR | Middle half of offers | Median loan amount | Average term |
|---|---|---|---|---|
| 781 and up | 5.69% | 5.30% to 6.09% | $29,843 | 65 months |
| 661 to 780 | 6.49% | 5.89% to 7.99% | $26,000 | 65 months |
| 601 to 660 | 9.00% | 7.93% to 11.23% | $27,106 | 66 months |
| 501 to 600 | 10.24% | 8.99% to 14.00% | $23,000 | 68 months |
Source: SuperMoney auto refinance applications and partner lender rate estimates, November 2025 to November 2026. Estimates are not offers and depend on the vehicle, term and lender.
When refinancing pays, and when it doesn’t
Run the numbers on your own loan before you apply. Take a $26,000 balance with 48 months left at 10.4%. Refinancing to 7.97% over the same 48 months cuts the payment from $664 to $634 and saves $1,443 in interest. Refinancing to 7.97% but stretching to 66 months cuts the payment to $488, which feels like a win, but you’d pay $305 more in total interest than if you’d kept the original loan. That’s the trap: a longer term can turn a lower rate into a higher total cost. Compare total interest, not just the monthly payment, before you sign.
Refinancing makes sense when your credit score has risen 40 points or more since you bought, when you financed at the dealership without shopping around (dealer markups of one to two points are common), or when rates have fallen since you signed. It doesn’t make sense when the lender charges a prepayment penalty on your current loan, when your car is more than ten years old or has over 125,000 miles (most refinance lenders won’t take it), or when you’re underwater by more than about 25% of the car’s value. Most lenders want you to have made at least six on-time payments first. Our guides to how to refinance a car loan and how often you can refinance walk through the process, and you can compare auto refinance lenders by rate, credit requirements and mileage limits.
What this means for you
The market in 2026 rewards two things: preparation before you shop and a willingness to say no to the term the dealer suggests. Here’s how to use the numbers in this study.
- Know your tier before you walk in. The gap between prime (6.15%) and near prime (9.71%) on a new car is $52 a month and $3,750 in interest on a $30,000 loan. If you’re within 20 points of the next tier, spend two months paying down card balances before you buy.
- Keep the term under 60 months for a new car and under 48 for a used car older than five years. On the average new loan, 84 months costs $3,560 more in interest than 60 months and keeps you underwater until roughly year four. If you can’t afford the car on a 60-month loan, you can’t afford the car.
- Put 20% down on a new car and 10% on a used one. That’s the fastest way to avoid negative equity, and it’s the opposite of what the market is doing (average down payments fell $467 in a year).
- Get pre-approved by a credit union or bank before you go to the dealer. Credit unions hold 20% of the market and the lowest rates. A pre-approval turns the dealer’s finance office into a competitor rather than your only option.
- If you’re subprime, treat the first loan as temporary. Make 12 on-time payments, then refinance. A move from 13.52% to 9.00% on $27,000 over 66 months saves about $62 a month.
- If you’re underwater, don’t roll it. Keep driving the car and pay extra on the principal until you’re above water, or sell privately rather than trading in. Rolling $7,107 of negative equity into a new loan costs $1,890 in interest and starts the next loan underwater too.
- Refinance without extending. Ask the lender to match your remaining term. You’ll see a smaller payment drop but keep all the savings.
- Track the loan. The SuperMoney app links your accounts so you can see your car payment next to your income, watch your credit score move, and know when you’ve crossed into a cheaper tier.
Methodology and definitions
This study compiles published data from government, Federal Reserve, credit bureau and industry sources as of November 6, 2026. We use the newest edition of each source and note the data period next to every figure. Where sources measure the same thing differently, we show both and explain the difference rather than averaging them.
- Balances. The New York Fed Consumer Credit Panel is a 5% sample of Equifax credit files and counts auto loans and leases. The Federal Reserve G.19 counts motor vehicle loans held by lenders and excludes leases. Experian, TransUnion and Equifax count from their own files.
- Delinquency. “90+ days delinquent” from the New York Fed is the share of outstanding dollars at least 90 days past due (a stock). The “transition rate” is the share of balances that became 90+ days delinquent over the prior four quarters (a flow). TransUnion and Equifax 60+ day rates count accounts or consumers, not dollars, so they are lower. Fitch’s index covers only subprime loans packaged into securities.
- Credit scores. Experian and Equifax use VantageScore 4.0 bands. The New York Fed switched from Equifax Risk Score 3.0 to VantageScore 4.0 in Q1 2026, so its score-bucket series is not strictly comparable across that break. Each source’s subprime cutoff is noted where it appears.
- Payments, terms and rates. Experian figures come from loans originated in the quarter across all lender types. Edmunds figures come from dealer transactions in its network. J.D. Power figures come from its Power Information Network of dealer transactions. Bankrate’s rates are a weekly survey of large banks. Cox Automotive’s affordability index uses a 72-month loan and its own rate survey, which runs higher than the other averages and is not mixed with them here.
- State data. Per-capita auto debt and 90-day delinquency by state come from the New York Fed’s annual state file (Q4 2025). Average balance per borrower comes from Experian (March 2026), cross-checked against the University of California Consumer Credit Panel fact sheets published by Protect Borrowers and The Century Foundation (Q4 2025), which agree within 1% to 4% for most states. New-loan APR and the share of 7+ year loans are from the same UC-CCP fact sheets and cover loans of all vehicle types opened in Q4 2025. State payments and APRs from Edmunds come from its interactive maps; Edmunds publishes no DC payment figure.
- SuperMoney data. Marketplace figures cover auto loan and auto refinance applications submitted through SuperMoney between November 2025 and November 2026 and the rate estimates returned by partner lenders. They describe our applicants, not the market, and are labeled as such.
- Worked examples. Monthly payments and interest totals are calculated with the standard amortization formula and rounded to the nearest dollar.
Frequently asked questions
What is the average car payment in 2026?
The average new-car payment is $787 a month and the average used-car payment is $582, according to Edmunds’ Q3 2026 data. Experian’s Q2 2026 figures are $765 for new and $542 for used, and the average lease payment is $617. J.D. Power recorded a record $823 average new-vehicle finance payment in October 2026.
What is the average auto loan interest rate right now?
The average APR was 6.35% on new vehicles and 11.19% on used vehicles in Q2 2026 (Experian). Rates range from 4.41% for super prime borrowers to 16.11% for deep subprime borrowers on new cars, and from 6.29% to 21.62% on used cars. Banks charged an average of 7.54% on 60-month new-car loans in August 2026, according to the Federal Reserve.
How much auto loan debt do Americans have?
$1.713 trillion as of Q2 2026, according to the New York Fed, which counts loans and leases on consumer credit reports. That’s about 9.1% of all household debt. The Federal Reserve’s narrower G.19 measure, which excludes leases, was $1.575 trillion.
Is auto loan debt bigger than student loan debt?
Yes, by a small margin. Auto loans ($1.713 trillion) passed student loans ($1.651 trillion) in the New York Fed’s Q2 2026 report. The two have traded places several times since 2023.
What is the average car loan length?
69.5 months for new vehicles and 67.9 months for used vehicles in Q2 2026, according to Experian. A quarter of new-car loans (25.5%) now run 84 months or longer, and loans over 72 months are a record 31.8% of financed deals.
What percentage of car loans are delinquent?
5.49% of auto loan balances were 90 or more days delinquent in Q2 2026 (New York Fed), the highest since 2010 apart from the Q1 2026 record of 5.60%. Measured by accounts rather than dollars, 1.64% of auto loans were 60 or more days late in Q3 2026 (TransUnion).
What percentage of Americans have a car payment over $1,000?
21.2% of new-car buyers who financed in Q3 2026 took on a payment of $1,000 or more, a record (Edmunds). Among used-car buyers the share was 6.5%. Among people who applied to refinance an auto loan through SuperMoney between November 2025 and November 2026, 20.6% were paying $1,000 or more.
What credit score do you need for a car loan?
There’s no minimum, but your score sets your rate. The average new-car borrower had a score of 751 and the average used-car borrower 688 in Q2 2026. Scores above 660 get prime pricing (6.15% new). Scores under 600 pay 13.5% or more on new cars and 19% or more on used cars, and lenders may require a larger down payment.
How much does refinancing a car loan save?
Borrowers who refinanced in Q2 2026 cut their rate from 10.40% to 7.97% and saved $83 a month on average, according to Experian. Credit union refinances saved $102 a month. Caribou, a refinance lender, reports $165 a month among its customers, who started with higher rates.
How soon can you refinance a car loan?
Most lenders want at least six months of on-time payments and a title in hand, and some want 12 months. The average refinance happens about 26 months after the original loan is opened (Experian). You can refinance more than once if the numbers work.
Which state has the highest auto loan debt?
Texas, on both measures. Texans owe $8,000 per person with a credit file (New York Fed, Q4 2025) and $30,939 per borrower (Experian, March 2026). New Mexico and Louisiana are next. DC ($3,350 per person) and Michigan ($19,754 per borrower) are the lowest.
Which state has the highest auto loan delinquency?
Among the 50 states, Mississippi, with 7.68% of auto loan balances 90 or more days late, followed by Georgia (6.99%) and Alabama (6.55%). The District of Columbia is higher than any state at 13.58%. Vermont (2.84%), North Dakota (2.92%) and Alaska (2.94%) are the lowest.
Andrew is the Content Director for SuperMoney, a Certified Financial Planner®, and a Certified Personal Finance Counselor. He loves to geek out on financial data and translate it into actionable insights everyone can understand. His work is often cited by major publications and institutions, such as Forbes, U.S. News, Fox Business, SFGate, Realtor, Deloitte, and Business Insider.
Share this post:
Add as a preferred source on Google
Table of Contents