
The Fed Asked About an Extra Month’s Pay. Should You Pay Off Debt or Save?

Last updated 10/13/2026 by
SuperMoney Team
Edited by
Andrew Latham
Summary:
The Federal Reserve asked U.S. households how they’d split a surprise payment worth one month of income. On average they’d spend 22%, save 47% and put 30% toward debt, and 47% of households wouldn’t spend a dime. If you’re wondering whether to pay off debt or save, the right answer depends on your interest rates and your cash cushion, not on what everyone else does. On a $7,290 month, sending $2,210 to a 22% credit card saves about $494 a year, versus about $88 in a 4% savings account.
Imagine your boss hands you an extra month’s pay, no strings attached. Do you book the trip, pad your savings or finally knock down that credit card? If you’ve ever asked yourself “should I pay off debt or save,” you’re in good company. The Federal Reserve just asked American households almost exactly that question, and the answers say a lot about how people feel about money right now.
The results come from a FEDS Note published October 9, 2026, written by Fed economists Aditya Aladangady, Jesse Bricker, Andrew C. Chang, Sarena Goodman and Gina Li. They added a new question to the 2025 Survey of Consumer Finances (SCF), the Fed’s every-three-years survey of household finances. Here’s what they found, what it means for you, and a simple way to decide what to do with your own windfall.
Get Competing Personal Loan Offers In Minutes
Compare rates from multiple vetted lenders. Discover your lowest eligible rate.
It's quick, free and won’t hurt your credit score
What the Fed asked, and how Americans answered
The question was simple. Imagine you unexpectedly receive a sum equal to one month of your family’s normal income. Over the next 12 months, what percentage would you save, spend and use to pay down debt?
On average, households said they’d spend 22.4%, save 47.3% and use 30.3% to pay down debt. Economists call that spending share the marginal propensity to consume, or MPC: the portion of an extra dollar that gets spent instead of saved. A 22% MPC means about 22 cents of every surprise dollar would go out the door.
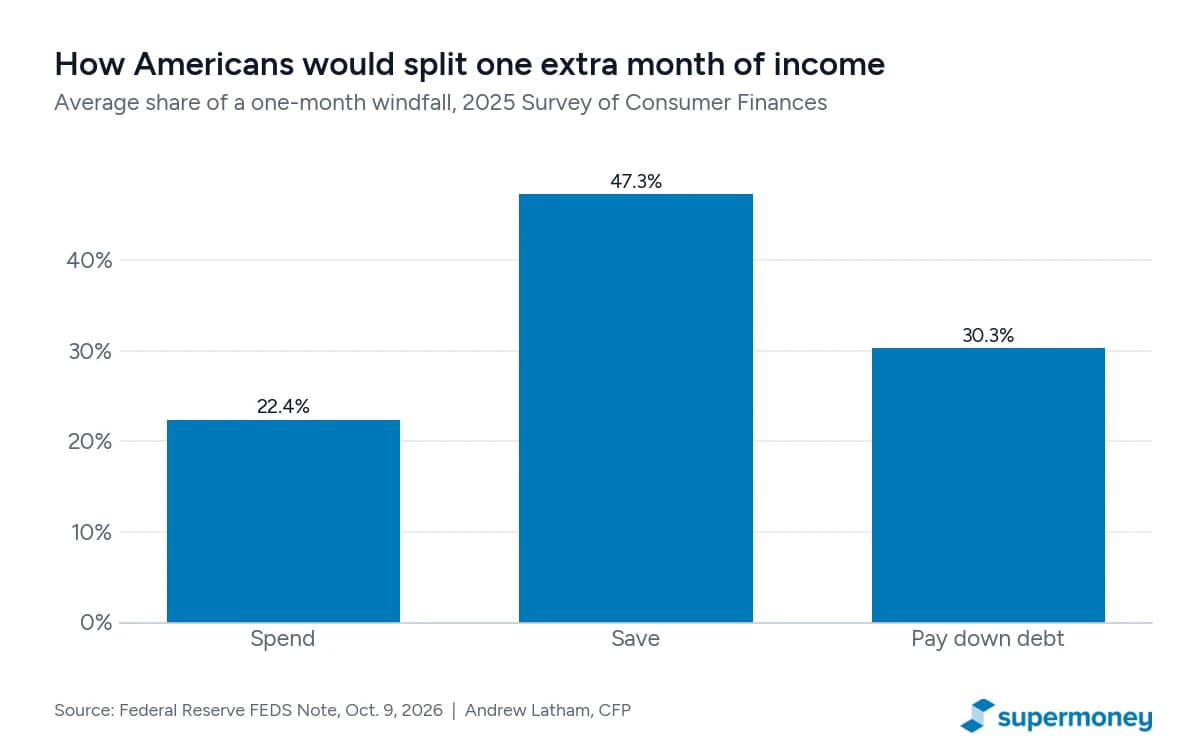
That’s a cautious crowd. The researchers say 22% sits toward the low end of what other studies have found, and it lines up closely with how people actually used the 2001 and 2008 stimulus rebates.
The two different 47% numbers (and why headlines mix them up)
A couple of news stories ran with “47% gave a sobering response,” and some treated it as one stat. It’s actually two separate findings that happen to land on almost the same number.
- 47% of the money gets saved. This is the average share of the windfall people would put into savings (47.3%). It describes dollars.
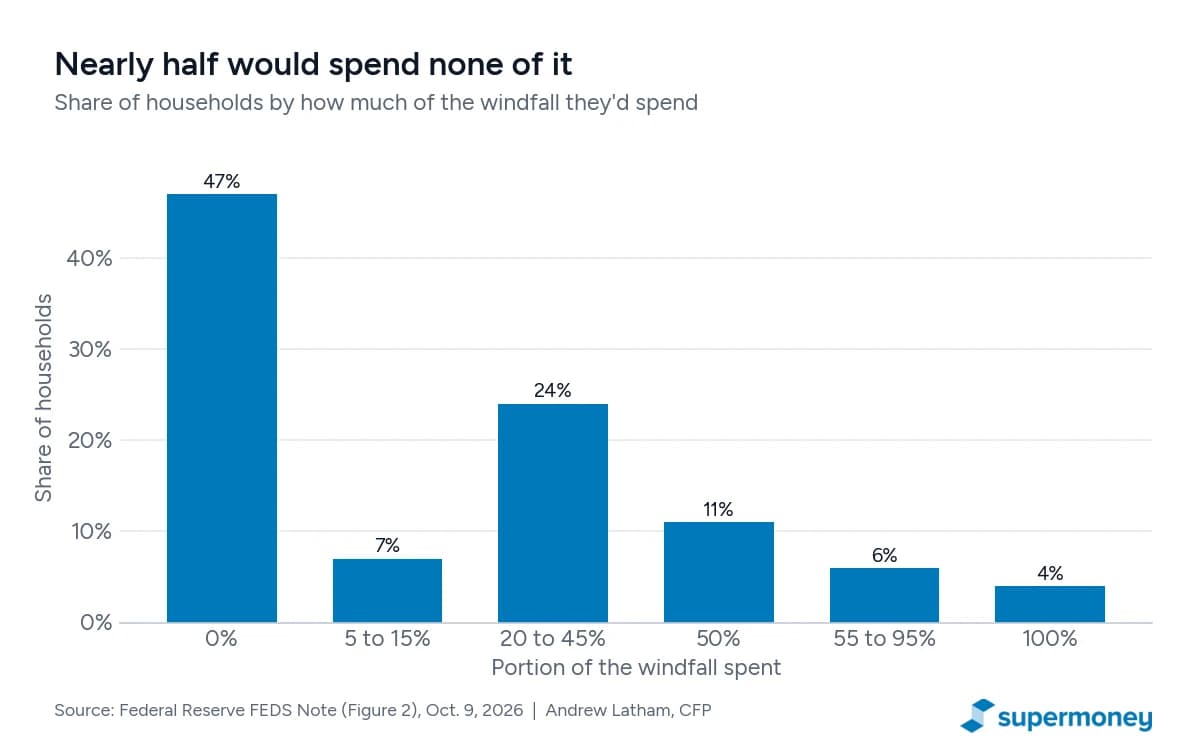
- 47% of households would spend nothing. This is the share of households that said they’d spend 0% of the windfall. It describes people.
Those are different questions. A household that spends nothing might still send most of the money to debt instead of savings. Meanwhile, only about 4% of households said they’d spend the whole thing. Most people who spend something spend 20% to 35%, and lots of answers cluster at round numbers like 50%.
What one month of pay looks like in real dollars
The Census Bureau puts 2025 median household income at $87,460, a record high. Divide by 12 and a typical month is about $7,290 before taxes (or about $6,340 after taxes). That’s close to the Fed’s own median windfall of $7,000 (the average was $11,800, pulled up by high earners).
Here’s how $7,290 would get split if you followed the national average, or the averages for a few income groups. Keep in mind that a bottom-10% household would really get a smaller check (about $1,500, per the Fed), so this table just lines up the percentages on the same dollar amount.
| If you split $7,290 like… | Spend | Save | Pay down debt |
|---|---|---|---|
| The national average | $1,630 | $3,450 | $2,210 |
| The bottom 10% of earners | $2,063 | $3,324 | $1,903 |
| The 60th to 70th percentile | $1,494 | $3,047 | $2,741 |
| The top 1% of earners | $1,021 | $5,650 | $620 |
Who spends, who saves and who pays down debt
The most interesting part of the study is how much the split changes as income rises. Spending drifts down slowly from 28% in the bottom 10% to around 19% to 20% in the upper-middle, then drops to 14% for the top 1%. Saving does the opposite at the top: the top 1% would save 77.5% and send just 8.5% to debt.
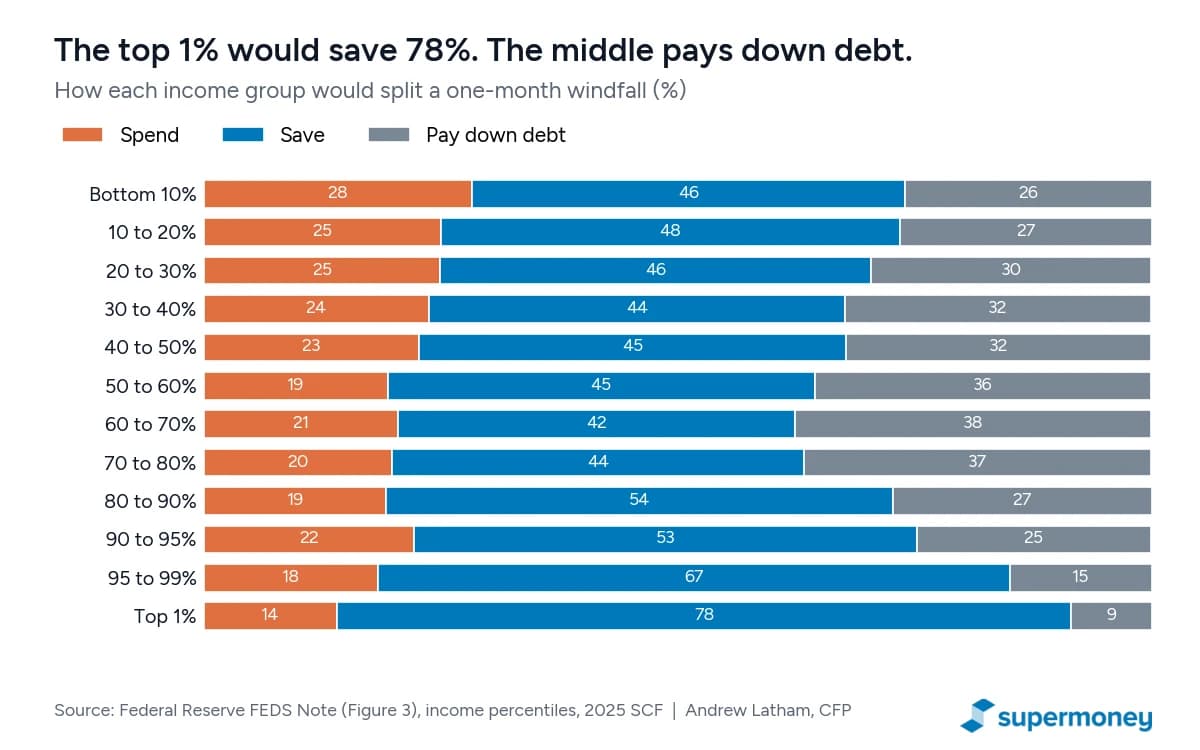
The middle class is where debt shows up. Households between the 50th and 80th income percentiles would put about 36% to 38% of a windfall toward debt, the highest of any group. That fits a common pattern: solidly middle-income families often carry a car loan, student loans and a card balance at the same time, and a windfall feels like a chance to finally breathe.
The Fed also found that “hand-to-mouth” households, meaning those with less than half a month of income in liquid savings, would spend a bit more (22.9% versus 20.3% after adjusting for income). So would households unsure about next year’s income, and those who missed questions on a short financial literacy quiz. The gaps are small.
Does what people say match what they do?
Surveys about hypothetical money can be optimistic, so it helps to check against real checks. When the New York Fed surveyed households about their 2020 pandemic stimulus payments, people reported that, as of the end of June 2020, 29% went to spending, 36% to savings and 35% to paying down debt. That’s remarkably close to the new SCF numbers.
Bigger windfalls tell a more cautionary story. A study of Florida lottery winners found that people who won $50,000 to $150,000 were less likely to go bankrupt right away, but were 50% more likely to file for bankruptcy three to five years later than people who won less than $10,000. The money postponed financial trouble instead of preventing it. If you ever land a truly big windfall, read what to do if you win the lottery before you touch a cent.
Pay off debt or save? A quick decision framework
The national average is interesting, but it isn’t advice. The right split for you comes down to three questions: what interest rate is your debt charging, how big is your cash cushion, and are you leaving free money on the table? For a deeper walkthrough with examples, see should I pay off debt or save.
Here’s the math that drives most of it. Credit card accounts that carry a balance are charging an average of 22.36%, according to the Fed’s latest consumer credit report. Many online high-yield savings accounts were paying around 4% APY in early October 2026, while the national average savings rate was just 0.37%, per the FDIC. I’ll use 4% as an illustrative savings rate below; check current rates before you move money.
Put $2,210 (the average debt slice) toward a card charging 22.36% and you avoid about $494 a year in interest. Put the same $2,210 in a 4% savings account and you earn about $88. That’s a difference of roughly $406 a year, and paying debt is a guaranteed return with no taxes owed on it.
| Your situation | What to do first | Real-number example |
|---|---|---|
| No emergency fund (less than one month of expenses in cash) | Save a starter cushion first, even if you have card debt | Without $1,000 to $2,000 in cash, the next car repair goes right back on the card at 22% |
| Employer 401(k) match you aren’t fully getting | Contribute enough to capture the full match | With a 50% match (illustrative), $1,000 you contribute becomes $1,500 immediately, a 50% return |
| Credit card or other debt above about 10% APR | Pay it down aggressively | $2,210 toward a 22.36% card saves about $494 a year, versus about $88 earned at 4% |
| Debt between about 5% and 10% | Split it between extra payments and savings | Half to a 7% personal loan, half to savings, keeps you flexible while still cutting interest |
| Low-rate debt under about 5% (older mortgage, cheap car loan) | Don’t rush; save or invest instead | Paying off a 3% mortgage early “earns” 3%, less than a 4% savings account |
| Cushion built, no high-rate debt | Invest for long-term goals, and spend a guilt-free slice | Putting $3,450 into a retirement account and enjoying $1,630 mirrors the national average split |
The order matters. I’d usually go: a starter emergency fund, then any employer match, then high-interest debt, then a full emergency fund of three to six months of expenses, then investing. If you’re building that cushion now, this guide on how to build an emergency fund walks through it step by step, and if you’ve already captured your match, here’s where to save after your 401(k) match.
Pay off debt or invest?
Investing is a different comparison than saving. Stocks have historically returned more than savings accounts over long stretches, but those returns aren’t guaranteed and can swing hard in any given year. Paying off a 22% card is a sure 22%. Paying off a 4% student loan is a sure 4%. My rule of thumb: high-rate debt goes first, low-rate debt can coexist with investing, and anything in the middle is a judgment call based on how much risk lets you sleep at night.
Compare yourself to the average
Here’s a quick self-check. Picture that extra month of pay landing in your account tomorrow and jot down your split. Then ask yourself:
- Would you spend more than 22%? You’re spending more than the average household. That’s fine if your debt is low and your cushion is solid.
- Would you spend nothing? You’re in the 47% of households that would put every dollar to work.
- Do you have credit card debt but plan to send less than 30% to it? You may be leaving the best guaranteed return on the table.
- Do you have less than half a month of income in savings? You’re “hand-to-mouth” by the Fed’s definition, and building cash should come first.
- Are you getting your full employer match? If not, start there before anything else.
Make a plan before the money shows up. If you want to see your full picture in one place, the SuperMoney app links your accounts, tracks your spending and net worth, and includes Sense AI, an AI money assistant you can ask about trade-offs like this one. And if debt is the priority, a debt repayment plan keeps the extra cash pointed at the right balance.
Frequently asked questions
Is it better to pay off debt or save?
It depends on the interest rate and your cushion. If you have no emergency savings, build a small cushion first. After that, debt charging more than about 10% (like a typical credit card at 22%) usually beats saving, because the interest you avoid is far higher than what a savings account pays.
What is a financial windfall?
A financial windfall is money you didn’t plan on: a bonus, a tax refund, an inheritance, a legal settlement, a lottery prize or an extra paycheck. The Fed’s study used a windfall equal to one month of normal income.
What should I do with a windfall?
Park it in a savings account while you decide, so it doesn’t leak into daily spending. Then follow an order: starter emergency fund, employer match, high-interest debt, full emergency fund, then investing. Spending a modest slice on something you enjoy is fine. Americans would spend about 22% on average.
What is the marginal propensity to consume?
The marginal propensity to consume (MPC) is the share of an extra dollar of income that a household spends rather than saves. The Fed’s new estimate puts the average U.S. MPC for a one-month windfall at 22%, ranging from 28% for the lowest earners to 14% for the top 1%.
Should I pay off debt or invest?
Compare the debt’s interest rate with a realistic, after-tax investment return. High-rate debt like credit cards should almost always come first. Low-rate debt, such as a mortgage under 5%, can usually stay on schedule while you invest, especially if you’re getting an employer match.
Key takeaways
- Given an extra month of income, U.S. households would spend 22%, save 47% and pay down debt with 30%, per the Fed’s 2025 Survey of Consumer Finances.
- 47% of households would spend none of it, and only 4% would spend it all. That’s a different stat from the 47% average savings share.
- The top 1% would save 77.5%, while middle-income households would send the most to debt (about 36% to 38%).
- A typical month of income is about $7,290 before taxes, based on 2025 median household income of $87,460.
- Paying $2,210 toward a 22.36% credit card saves about $494 a year, versus about $88 earned in a 4% savings account.
Share this post:
Add as a preferred source on Google
Table of Contents