
There’s a Second Inflation Number You Don’t Know About. It’s the One That Moves Your Rates

Last updated 10/30/2026 by
SuperMoney Team
Edited by
Andrew Latham
Summary:
PCE inflation, the measure the Federal Reserve targets, rose to 3.6% in September, and core PCE was 3.1%. That’s close to the better-known Consumer Price Index (3.7%), but the two are built differently, and this year core PCE is running half a point above core CPI. Neither number is your inflation, though. What you pay depends on what you buy, and a commuter can face prices rising nearly twice as fast as someone who works from home.
Everyone has heard of the Consumer Price Index. There’s a second inflation number most people have never heard of, and it’s the one the Federal Reserve uses to set interest rates. That makes it the one that moves your rates.
It came out Thursday. The Personal Consumption Expenditures (PCE) price index rose 3.6% in the year through September, up from 3.4% in August, according to the Bureau of Economic Analysis (BEA), the Commerce Department agency that tracks the economy. Prices rose 0.5% in September alone.
Core PCE, which leaves out food and energy, rose 3.1% from a year earlier. The Fed’s goal is 2%.
Get Competing Personal Loan Offers In Minutes
Compare rates from multiple vetted lenders. Discover your lowest eligible rate.
It's quick, free and won’t hurt your credit score
What PCE inflation measures
PCE tracks the prices of everything households spend money on, plus things others spend on their behalf. It’s built from the same data the government uses to measure consumer spending in the economy as a whole.
The Consumer Price Index (CPI), from the Bureau of Labor Statistics (BLS), is narrower. It tracks what households pay out of their own pockets. You can read more about how the CPI works and how it compares with personal consumption expenditures as an economic measure.
Here’s how the four headline numbers lined up for September 2026:
| Measure | What it covers | Year over year, September 2026 |
|---|---|---|
| CPI | Out-of-pocket household spending | 3.7% |
| PCE | Spending by and on behalf of households | 3.6% |
| Core CPI | CPI minus food and energy | 2.6% |
| Core PCE | PCE minus food and energy (the Fed’s closest watch) | 3.1% |
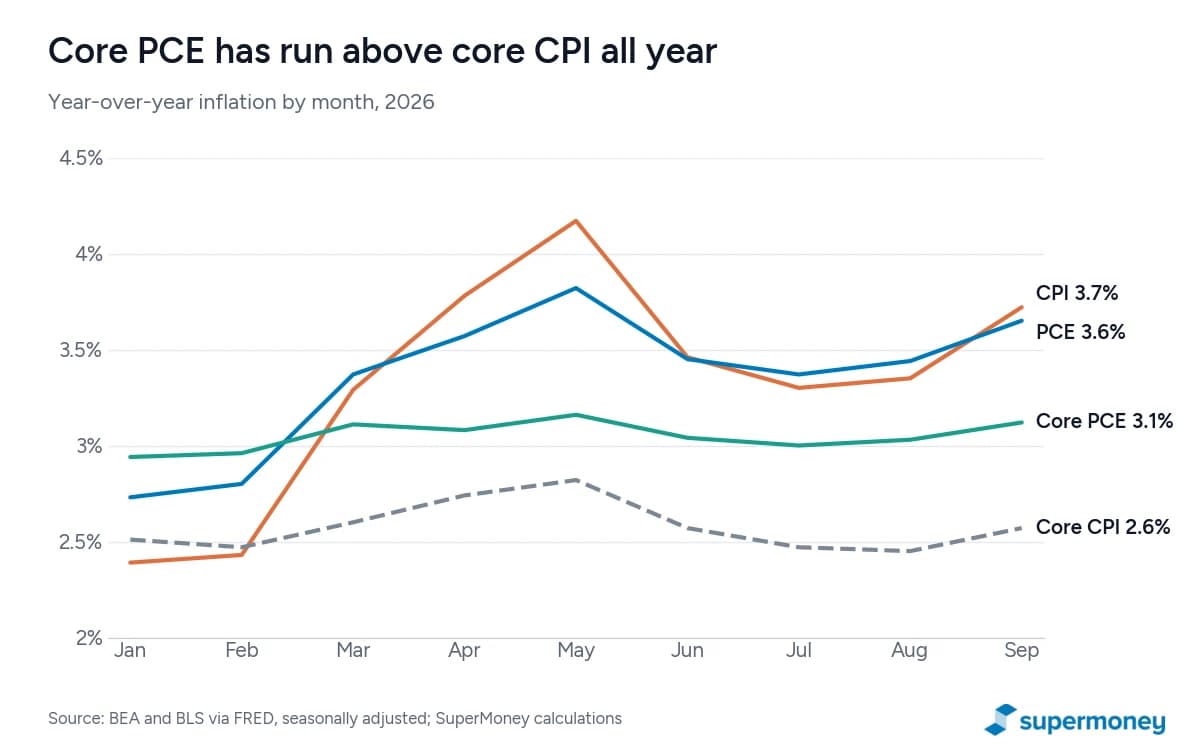
Headline CPI and PCE moved together this year, both pushed up by energy. The core numbers tell a different story. Core PCE has run above core CPI every month of 2026, by about half a point in September.
Why the two numbers don’t match
The BEA points to three differences.
Scope. PCE counts spending made on your behalf, not just what you pay at the register. The share of your health insurance your employer pays and the bills Medicare covers are in PCE. They aren’t in CPI, which only counts what households pay directly.
Weights. The two indexes give different importance to the same things. Housing is the biggest example. Rent and the cost of owning a home make up about a third of CPI but a much smaller share of PCE, so when housing costs and other prices move at different speeds, the two measures split.
Formula. PCE updates its weights as people change what they buy. If beef gets expensive and shoppers switch to chicken, PCE picks that up faster. Over long stretches, that usually makes PCE run a bit lower than CPI, though not every month or every year.
Why PCE matters more than you’d think
The Fed’s 2% inflation goal is written in terms of PCE, not CPI. When Fed officials say inflation is too high, this is the number they mean.
That matters for your money because the Fed sets short-term interest rates based partly on where it thinks PCE is heading. Those decisions ripple into what you earn on a high-yield savings account or CD, what your credit card charges, and where mortgage rates land. Core PCE at 3.1% and rising is a sign the Fed has more work to do, which makes quick rate cuts less likely.
CPI still drives other parts of your finances. Versions of it set the annual Social Security cost-of-living adjustment and the IRS inflation adjustments behind things like 2027 tax brackets. So both numbers touch your wallet, through different doors.
Your inflation rate isn’t on the news
Here’s the catch with every one of these numbers. They describe an average household that doesn’t exist.
Prices don’t rise evenly. Over the past year, gasoline is up about 34%, electricity about 4%, dining out about 3.5%, rent about 3%, and groceries less than 2%, according to BLS data. Your inflation depends on how much of your budget goes to each.
Take two hypothetical households, each spending $5,000 a month:
| Monthly spending | Commuter | Works from home |
|---|---|---|
| Gas | $450 | $80 |
| Rent | $1,800 | $1,800 |
| Groceries | $900 | $1,000 |
| Dining out | $400 | $550 |
| Electricity | $200 | $220 |
| Medical care | $300 | $400 |
| Everything else | $950 | $950 |
| Personal inflation rate | 5.4% | 3.1% |
| Extra cost per year vs. a year ago | About $3,250 | About $1,850 |
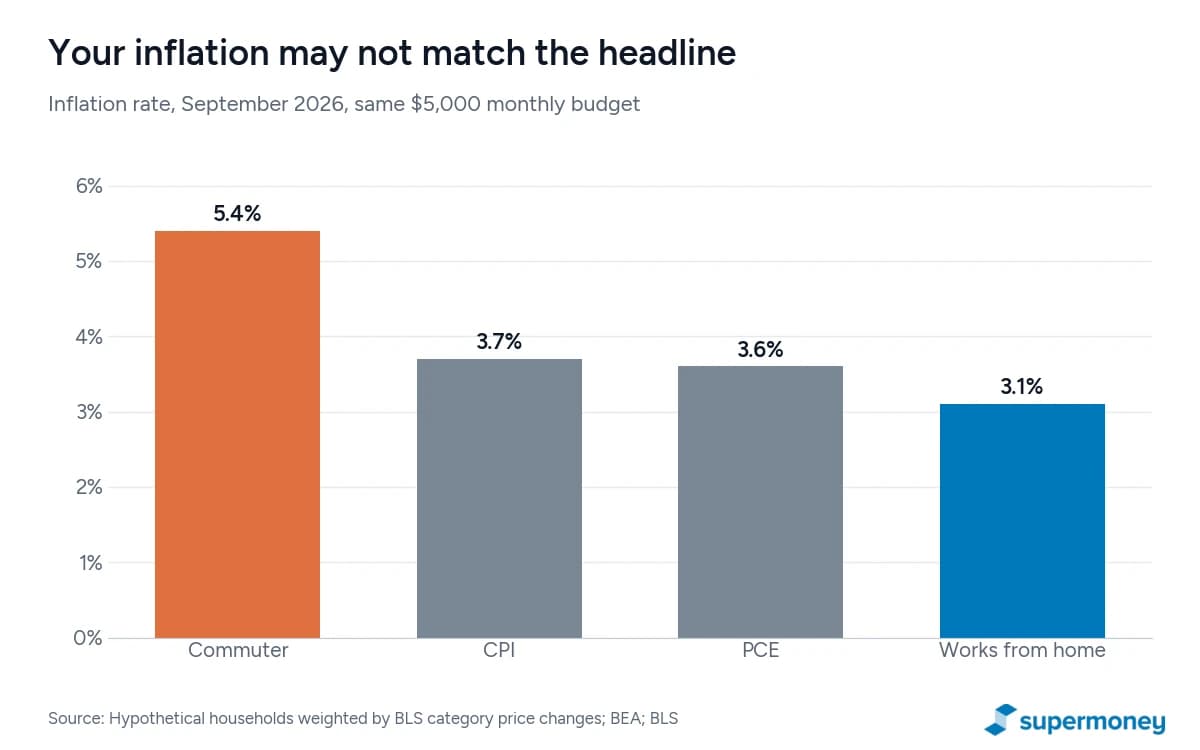
Same budget, same rent. The commuter’s prices are rising almost twice as fast, and almost all of the gap is the gas tank. That’s why gas has been the real budget hit this fall, even with grocery prices barely moving.
You can work out your own rate with the same math: weight each category’s price change by your share of spending. Our guide to calculating the inflation rate walks through it.
How to find your own number
The hard part isn’t the math. It’s knowing where your money actually goes. Most people guess, and most people guess wrong on the small, frequent stuff.
You can try SuperMoney free with a trial, link your accounts, and see your spending sorted by category automatically. Then ask Sense™, our AI money coach, which categories are costing you more than last year and where you have room to adjust. It’s built around your real numbers, not the average household’s.
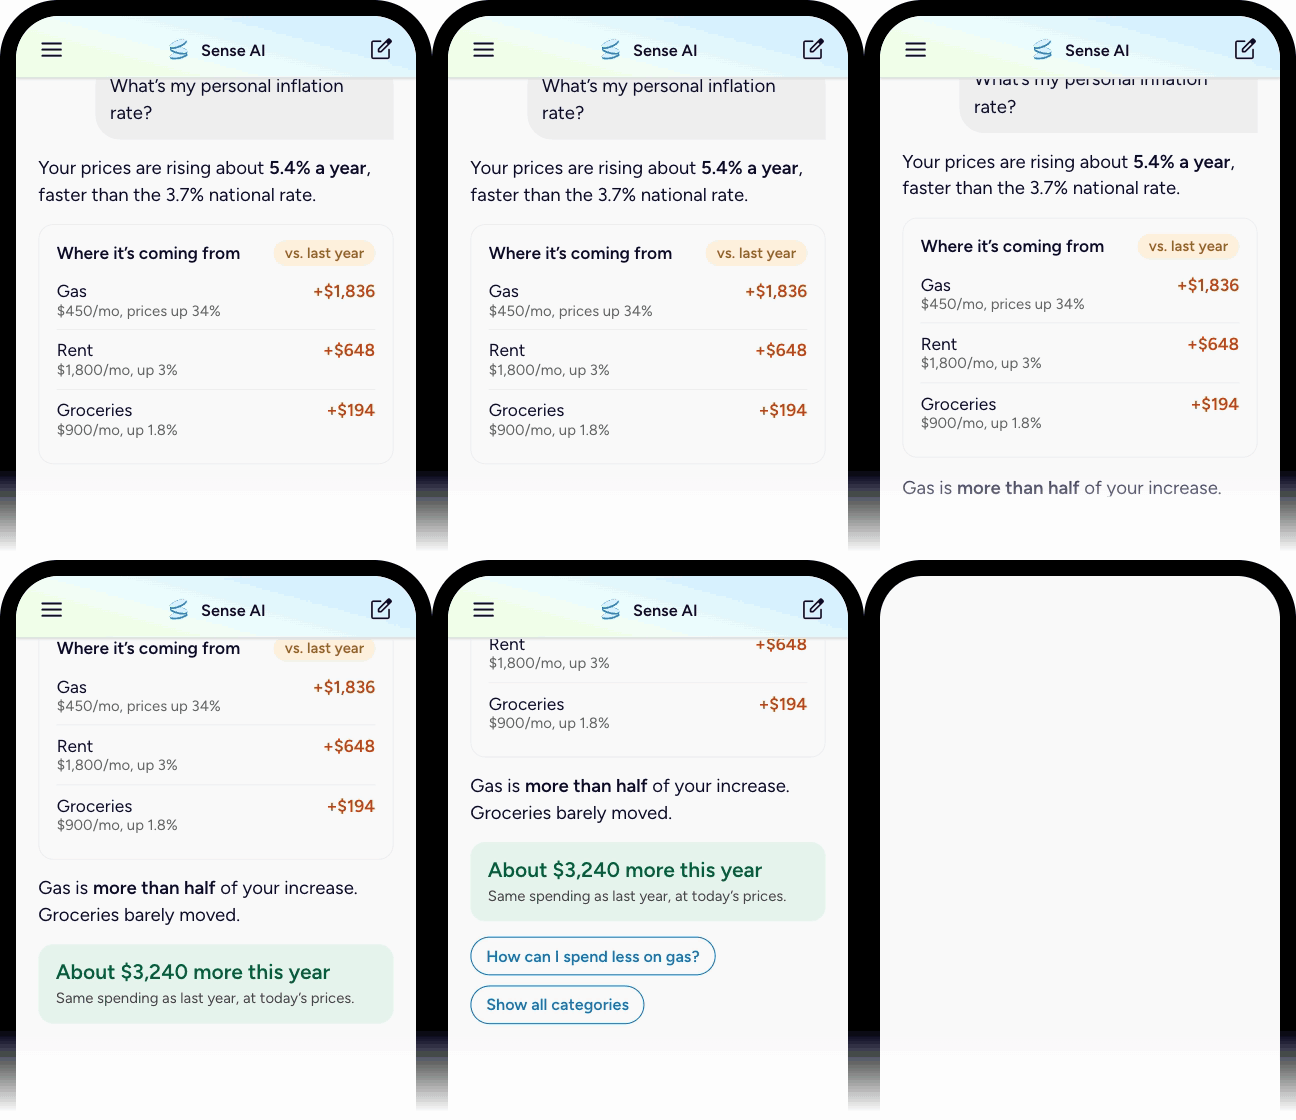
Once you know your own inflation rate, the headlines get a lot less stressful. A 3.6% national number doesn’t tell you much. Your 5.4%, or your 3.1%, tells you exactly where to look.
Key takeaways
- PCE inflation rose to 3.6% in the year through September 2026, and core PCE, which excludes food and energy, rose 3.1%.
- The Federal Reserve’s 2% inflation goal is measured with PCE, so it shapes interest rate decisions more than CPI does.
- CPI (3.7% in September) tracks out-of-pocket spending; PCE also counts spending on your behalf, like employer-paid health insurance and Medicare.
- Core PCE has run above core CPI all year, about half a point higher in September.
- Your personal inflation depends on your spending mix. In our example, a commuter faces 5.4% while a remote worker faces 3.1% on the same $5,000 budget.
- Track your spending by category to find your own rate and the categories driving it.
Share this post:
Add as a preferred source on Google
Table of Contents