
Average 401(k) Balance by Age: Why the Median Is the Number That Matters

Last updated 10/28/2026 by
SuperMoney Team
Edited by
Andrew Latham
Summary:
The median 401(k) balance is $18,732 for savers 25 to 34, $46,919 at 35 to 44, $78,730 at 45 to 54 and $107,269 at 55 to 64, according to Vanguard’s 2026 data. Averages run two to four times higher because a few big accounts pull them up. The median is the number that matters, and most people are less behind than they think.
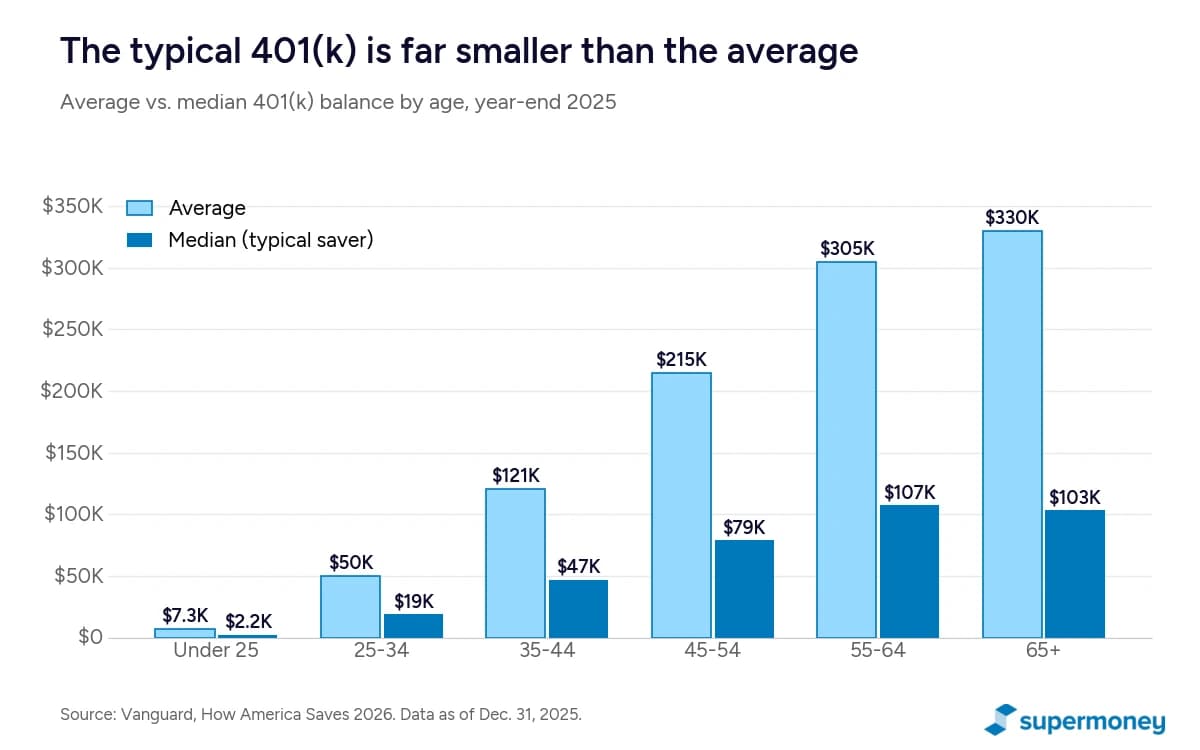
Here’s the average and median 401(k) balance by age for about 5 million savers in plans Vanguard runs. The median is the typical saver: half have more, half have less.
| Age | Average 401(k) balance | Median 401(k) balance |
|---|---|---|
| Under 25 | $7,259 | $2,234 |
| 25 to 34 | $50,261 | $18,732 |
| 35 to 44 | $120,742 | $46,919 |
| 45 to 54 | $214,991 | $78,730 |
| 55 to 64 | $305,006 | $107,269 |
| 65 and older | $330,186 | $103,202 |
| All ages | $167,970 | $44,115 |
Data as of December 31, 2025. Source: Vanguard, How America Saves 2026 (published June 2026), Figure 53. Covers about 5 million participants in more than 1,300 plans Vanguard administers.
Fidelity, which runs the largest 401(k) business in the country, reports a similar picture. Its average 401(k) balance hit a record $155,800 on June 30, 2026, across 25.8 million savers, up 13% from a year earlier. Fidelity doesn’t publish a median, which is a problem we’ll get to.
See where you stand in two minutes. Link your 401(k), IRAs and bank accounts in the free SuperMoney app and see your full retirement balance in one place, next to your net worth. Then ask Sense AI, the app’s built-in money coach, whether you’re on pace for your age and what to change first. Download it on the App Store or Google Play.
Compare Investment Advisors
Compare the services, fees, and features of the leading investment advisors. Find the best firm for your portfolio.
Why the median is the number that matters
Every 401(k) chart you’ve seen online leads with the average. It’s the wrong number to compare yourself to.
Picture 10 coworkers. Nine have $40,000 in their 401(k). One has $1.5 million. The average is $186,000, and nine out of ten people in that room are “below average.” Nobody in the room actually has $186,000.
That’s roughly what’s happening in the real data. Vanguard’s average balance across all ages is $167,970, but its median is $44,115. The average is 3.8 times the median. Vanguard says its averages land near the 75th percentile: about 3 in 4 savers have less than the average. So if you’re 40 with $60,000 saved and feel behind because a headline said the average 40-something has $120,000, you’re actually ahead of the typical person your age.
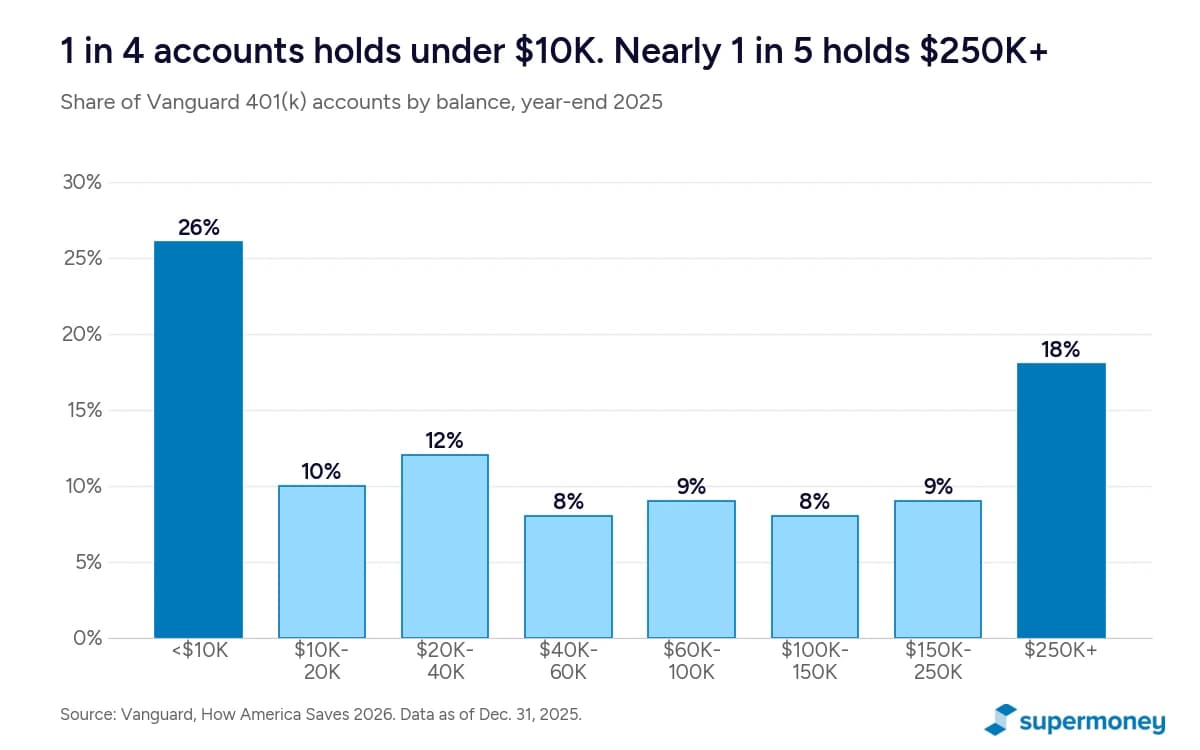
The skew comes from the top. In 2025, 26% of Vanguard accounts held less than $10,000, while 18% held $250,000 or more. Those big accounts belong mostly to older, higher-paid people who have stayed at one employer a long time, and they drag the average up for everyone.
Why most people are less behind than they think
Even the median understates what most people have, for three reasons.
1. A 401(k) balance is one account, not your whole retirement. Vanguard counts what you’ve saved with your current employer. If you rolled an old 401(k) into an IRA, or left one behind at a past job, it’s not in these numbers. Vanguard says so directly: plan balances “are only a partial measure” of retirement readiness. The Federal Reserve’s Survey of Consumer Finances, which counts every IRA and workplace plan a family owns, finds much higher totals. Among families with these accounts, the average combined balance in 2025 was $182,400 for ages 35 to 44 and $415,800 for ages 45 to 54. (It’s a household number, and still an average, so it skews high too.) If you have money in a few places, add it up before you judge yourself. Our guide to tracking down forgotten 401(k) accounts takes about 15 minutes and could find money you forgot you had.
2. Job changes reset the counter. Vanguard’s median for people with less than two years at their employer is $3,327. For people with 10 or more years, it’s $186,335. Same people, often, just measured at different points. If you switched jobs recently and rolled your old balance into an IRA, your 401(k) looks tiny on paper even though your savings didn’t go anywhere.
3. Time does a lot of the work. Run the math on the typical 40-year-old. Say you earn $30 an hour, about $62,400 a year, and you have the median $46,919 saved. If you and your employer put in 15% of pay ($9,360 a year) and the account earns 4% a year after inflation, you’d have about $576,000 by 67, measured in current dollars. That’s 9.2 times your salary, close to Fidelity’s 10x target. Behind at 40 isn’t the same as behind at 67.
That’s the honest version of “less behind than you think.” You’re probably closer to your peers than the averages suggest. Whether you’re on track for your own retirement is a different question, and that’s where benchmarks come in.
How much should you have saved by 30, 40, 50 and 60?
Fidelity’s widely used rule of thumb measures savings as a multiple of your salary, which makes it fairer than a single dollar figure. Someone earning $45,000 and someone earning $200,000 need very different amounts.
| By age | Fidelity target | On a $62,400 salary | On a $100,000 salary |
|---|---|---|---|
| 30 | 1x salary | $62,400 | $100,000 |
| 40 | 3x salary | $187,200 | $300,000 |
| 50 | 6x salary | $374,400 | $600,000 |
| 60 | 8x salary | $499,200 | $800,000 |
| 67 | 10x salary | $624,000 | $1,000,000 |
Source: Fidelity Viewpoints, “How much do I need to retire?” (September 2026). Assumes you save 15% of income a year from age 25, including any employer match, invest more than half in stocks, and retire at 67.
For a deeper look at each age and what to save if you’re behind, see how much you should have in your 401(k) at 30, 40 and 50.
These targets count everything you’ve saved for retirement: 401(k)s, IRAs and taxable investing accounts, not just your current plan. They also assume you started at 25. If you started at 32, being under 1x at 30 isn’t a failure. It’s arithmetic.
Compared with these targets, the median saver is behind. A 45- to 54-year-old with the median $78,730 is well short of 6x on almost any salary. On a $100,000 salary, which works out to about $48 an hour, 3x by 40 means $300,000, more than six times the median for that age group. That gap is real, and it’s why the fixes below matter more than the comparisons above.
Your 401(k) is also only one piece of your balance sheet. For the bigger picture, including home equity and debt, see how your net worth compares by age.
Your retirement isn’t a race
Now that you’ve seen all the numbers, here’s the part I most want you to hear: none of them is a finish line.
Take two 38-year-olds. One has $120,000 in her 401(k). She’s worked at the same company since college and never had a gap. The other has $25,000. He spent his twenties paying off student loans, took two years off to care for his mom, and just started a job with a good match. On a chart, he’s “behind.” In real life, he paid off his debt, showed up for his family, and is now saving 15% of every paycheck. I wouldn’t trade his habits for her balance.
Averages and medians describe millions of strangers. They can’t see that you have a pension, or a spouse with a big 401(k), or a plan to work part time until 70 because you like your job. They don’t know you moved across the country, started a business, or had a kid at 25 instead of 35. They can’t tell whether you want to retire at 55 or never fully retire at all. There isn’t one right path, so there isn’t one right number for your age.
Comparing yourself to the average mostly produces one of two feelings: smug or panicked. Neither one helps you save. The comparison that does help is with yourself. Are you saving more than you were a year ago? Are you getting the full match? Do you know what you’re saving for?
If you can answer yes to those, you’re doing the work, whatever a chart says. Retirement is a long journey with detours, and the people who get there are usually the ones who keep going, not the ones who started fastest.
What the typical saver is putting in
Savings rates are at record highs. In Fidelity’s second-quarter 2026 data, the average 401(k) saver put in 9.6% of pay and got 4.8% from their employer, for a total of 14.4%. That’s just shy of Fidelity’s 15% target. And 81.2% of savers contributed enough to get their full employer match.
If you’re under 15% total, here’s what closing the gap looks like on a $62,400 salary: going from 10% to 15% total means about $3,120 more a year, or $120 per biweekly paycheck before taxes. Because 401(k) contributions come out pre-tax, your take-home pay drops by less than that. In the 22% federal bracket, it’s closer to $94 a paycheck.
How to catch up if you’re behind
You don’t need a perfect plan. You need the next right move, in this order:
- Get the full match first. It’s an instant return of 50% or 100% on the money you put in. If you’re not getting it, nothing else on this list comes close.
- Raise your rate 1% a year. Most plans let you schedule automatic increases. You won’t notice 1% on a raise. Ten years of it adds up to a 10-point higher savings rate.
- Know your limit. In 2026 you can put up to $24,500 into a 401(k), plus $8,000 more in catch-up contributions at 50 and older and $11,250 at 60 to 63. Here’s how the 401(k) contribution limits work, and the 2027 limit is likely rising to $25,500.
- Decide where the next dollar goes. Once you have the match, a Roth IRA or HSA can beat more 401(k) money. We walk through it in where to save after the 401(k) match.
- If you’re over 50, use the extra room. Catch-up contributions exist for exactly this. These ways to catch up on retirement savings after 50 start with the biggest levers.
If you’d like a professional to look at your whole picture, you can compare financial advisors on SuperMoney.
Frequently asked questions
What is the average 401(k) balance by age?
According to Vanguard’s How America Saves 2026, the average 401(k) balance at the end of 2025 was $7,259 under age 25, $50,261 at 25 to 34, $120,742 at 35 to 44, $214,991 at 45 to 54, $305,006 at 55 to 64 and $330,186 at 65 and older. The medians were $2,234, $18,732, $46,919, $78,730, $107,269 and $103,202.
What is the median 401(k) balance?
The median 401(k) balance across all ages was $44,115 at the end of 2025, up 16% from 2024, per Vanguard. The average was $167,970.
What is a good 401(k) balance at 30?
Fidelity suggests about 1x your salary saved by 30, counting all retirement accounts. On a $62,400 salary, that’s $62,400. The median 401(k) for 25- to 34-year-olds is $18,732, so most people are under that target at 30, often because they started saving after 25.
How much should I have in my 401(k) at 40?
Fidelity’s guideline is 3x your salary by 40, across all retirement savings. The median 401(k) for ages 35 to 44 is $46,919 and the average is $120,742. Our guide to 401(k) targets by age walks through what to do if you’re short.
How much should I have in my 401(k) at 50?
Fidelity’s guideline is 6x your salary by 50. The median 401(k) for ages 45 to 54 is $78,730 and the average is $214,991. At 50 you also get $8,000 a year in extra catch-up room in 2026.
What is the average 401(k) balance at 65?
Vanguard’s average for savers 65 and older is $330,186, and the median is $103,202. The median dips slightly from the 55-to-64 group because many retirees start withdrawing or roll their balance into an IRA.
Why is the average 401(k) so much higher than the median?
A small number of very large accounts pull the average up. In 2025, 18% of Vanguard accounts held $250,000 or more while 26% held less than $10,000. Vanguard says its averages reflect savers at about the 75th percentile, so the median is a better measure of the typical person.
What percentage of people have $1 million in their 401(k)?
A small share. Vanguard reports 18% of its accounts hold $250,000 or more, and only a fraction of those top $1 million. Fidelity’s average balance of $155,800 in mid-2026 was a record, and it’s still far from seven figures.
Does the average 401(k) include IRAs?
No. Vanguard and Fidelity 401(k) figures only count the balance in a current workplace plan. Rollovers to IRAs, old plans and other investments aren’t included, which is why most people have more saved than their 401(k) alone shows.
Key takeaways
- The median 401(k) is $18,732 at 25 to 34, $46,919 at 35 to 44, $78,730 at 45 to 54 and $107,269 at 55 to 64 (Vanguard, year-end 2025).
- The average across all ages is $167,970, 3.8 times the $44,115 median. About 3 in 4 savers have less than the average.
- A 401(k) balance is one account. Rollovers, IRAs and old plans aren’t counted, so most people have more than it shows.
- Fidelity’s targets: 1x salary by 30, 3x by 40, 6x by 50, 8x by 60 and 10x by 67, across all retirement savings.
- A 40-year-old earning $62,400 with the median $46,919 who saves 15% could reach about $576,000 by 67 at a 4% real return.
- The average saver puts in 14.4% of pay including the employer match, near Fidelity’s 15% target.
- Benchmarks are a tool, not a scorecard. Your goals, timeline and circumstances matter more than where you rank against strangers.
Your number is the one that counts. Averages tell you about other people. The free SuperMoney app shows you yours: link every retirement and bank account in one place, watch your net worth move each month, and get personalized tips from Sense AI on what to do next. Get it on the App Store or Google Play.
Share this post:
Add as a preferred source on Google
Table of Contents