
Net Worth by Age: Median, Average and Percentiles (2026 Report)

Last updated 11/06/2026 by
SuperMoney Team
Edited by
Andrew Latham
Summary:
The median U.S. household has a net worth of $215,900, ranging from $33,000 for households under 35 to $504,900 for those 75 and older. Compare yourself to the median, not the average. The average is roughly four to five times higher at every age because a small number of very wealthy households pull it up.
Data as of: Federal Reserve 2025 Survey of Consumer Finances, released October 9, 2026. All figures are in 2025 dollars and grouped by the age of the household head.
Compare Investment Advisors
Compare the services, fees, and features of the leading investment advisors. Find the best firm for your portfolio.
Median and average net worth by age
| Age of household head | Median net worth | Average net worth |
|---|---|---|
| Under 35 | $33,000 | $135,400 |
| 35-44 | $155,600 | $681,900 |
| 45-54 | $253,700 | $1,244,500 |
| 55-64 | $411,900 | $1,878,000 |
| 65-74 | $431,300 | $1,897,600 |
| 75 and older | $504,900 | $1,962,200 |
| All households | $215,900 | $1,241,500 |
Source: Federal Reserve, Changes in U.S. Family Finances from 2022 to 2025, Table 2.1
Net worth percentiles by age
Here’s the net worth you need to reach each percentile for your age group. The 50th percentile is the median.
| Age | 25th | 50th | 75th | 90th | 99th |
|---|---|---|---|---|---|
| Under 35 | $3,100 | $33,000 | $147,000 | $351,000 | $1.6M |
| 35-44 | $17,600 | $155,600 | $470,000 | $1.23M | $8.3M |
| 45-54 | $54,700 | $253,700 | $940,000 | $2.58M | $14.6M |
| 55-64 | $72,600 | $411,900 | $1.40M | $3.41M | $20.5M |
| 65-74 | $118,000 | $431,300 | $1.32M | $3.60M | $20.5M |
| 75+ | $145,000 | $504,900 | $1.42M | $4.14M | $20.4M |
| All | $27,800 | $215,900 | $812,000 | $2.55M | $16.5M |
The Fed doesn’t publish percentile cutoffs by age, so we calculated them from its public 2025 survey data, using the survey weights and averaging across the five data sets the Fed releases (its standard method).2 The 50th percentile column shows the Fed’s published median. Our medians from the public file land within about 2% of it, so treat the other cutoffs as close estimates.
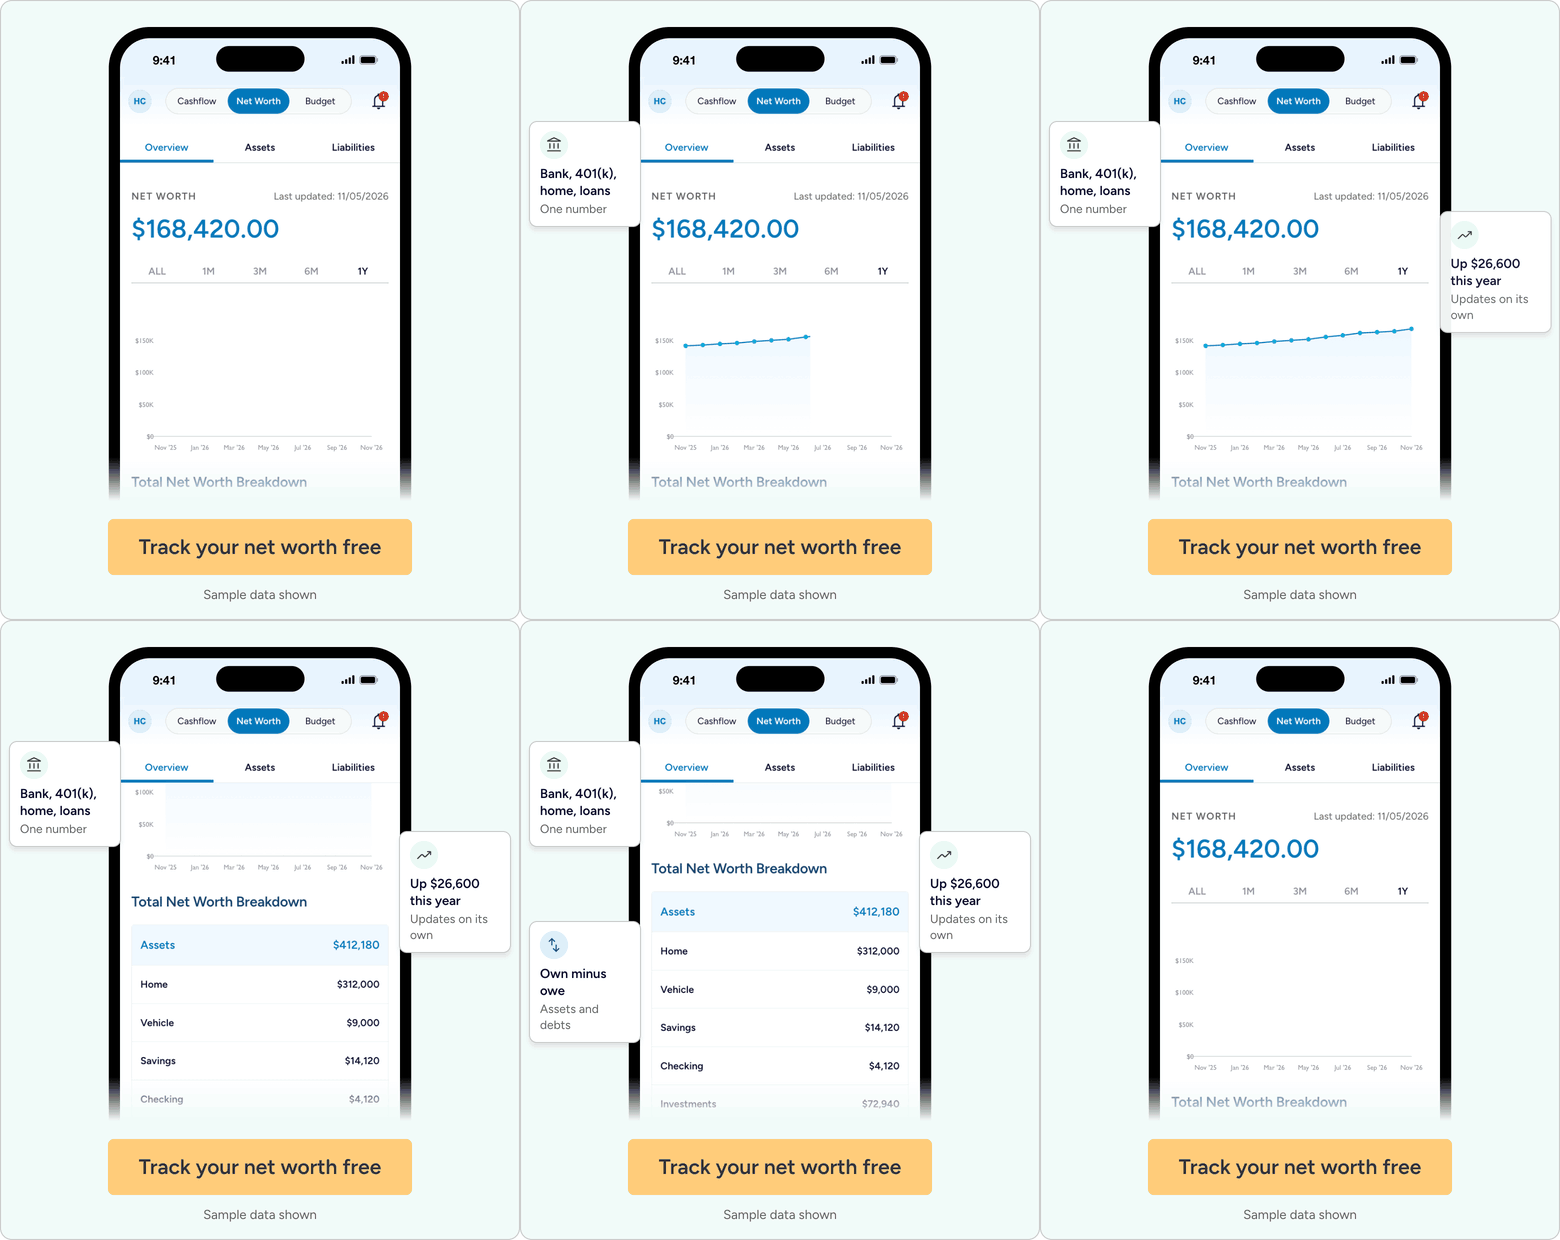
See your real net worth in one place and get personalized tips to grow it. SuperMoney links your bank, investment, loan and credit card accounts, and adds them up into one number that updates as your balances change.
Get the app: App Store | Google Play
Why the median is the number that matters
Net worth is everything you own (cash, retirement accounts, home equity, investments, a business) minus everything you owe (mortgage, car loans, student loans, credit cards). If you’re new to the idea, here’s how to calculate your net worth.
The median is the household in the exact middle: half have more, half have less. The average adds everyone up and divides, so a few households worth $50 million drag it far above what a typical family has. Picture 10 coworkers at a bar with $100,000 each. A billionaire walks in, and the average net worth in the room jumps to about $91 million. The median doesn’t move at all.
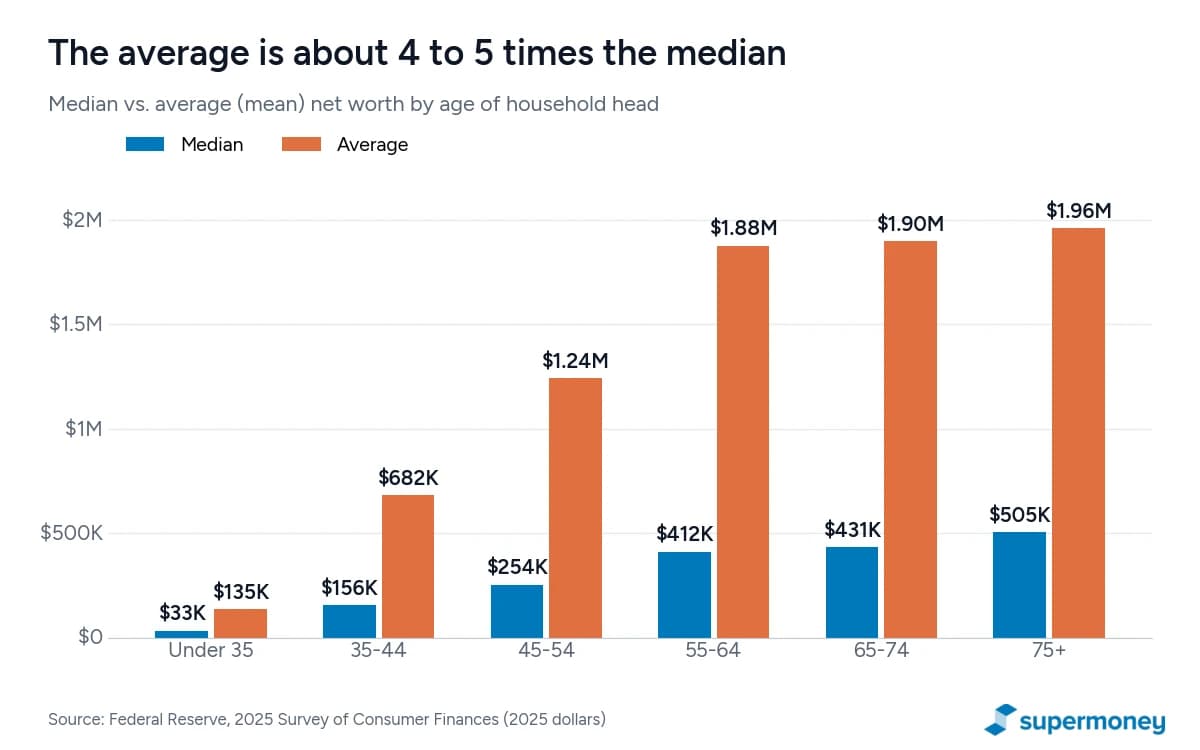
That’s why a 50-year-old with $250,000 who reads that the “average” 45-54 household has $1.24 million can feel badly behind when they’re actually right at the middle. Fewer than 1 in 5 households in that age group has a net worth above the average.
Net worth in your 20s and 30s
The under-35 bracket lumps a 22-year-old with student loans together with a 34-year-old homeowner. Splitting it into five-year groups gives a fairer benchmark. These medians come from our analysis of the same Fed data. Samples get small at this level, so read them as rough guides.
| Age | Median net worth |
|---|---|
| 20-24 | $12,900 |
| 25-29 | $35,400 |
| 30-34 | $63,800 |
| 35-39 | $125,300 |
| 40-44 | $184,200 |
Median net worth nearly doubles every five years from your late 20s to your late 30s. A lot of that is time and compound growth, and a lot is buying a home and paying the mortgage down.
Where does your net worth rank for your age?
Pick your age group and enter your net worth below to see your percentile. Say you’re 40 with $300,000. That’s above the 35-44 median of $155,600 and below the 75th percentile of $470,000, at about the 67th percentile for your age.
A percentile is a snapshot. Your next move is what changes it. The SuperMoney app tracks your net worth automatically as balances change and gives you personalized tips, like flagging high-interest debt or spending that’s crept up.

Get the app: App Store | Google Play
What changed since 2022
Young households lost ground. Median net worth for households under 35 fell 23%, from $42,700 in 2022 to $33,000 in 2025, after adjusting for inflation. The Fed says the drop was mostly the unwinding of business equity gains young families had made between 2019 and 2022.1
Households 75 and older moved the other way. Their median jumped 37% to $504,900, making them the wealthiest age group for the first time in several surveys. The Fed traces that mainly to growth in retirement account balances.1
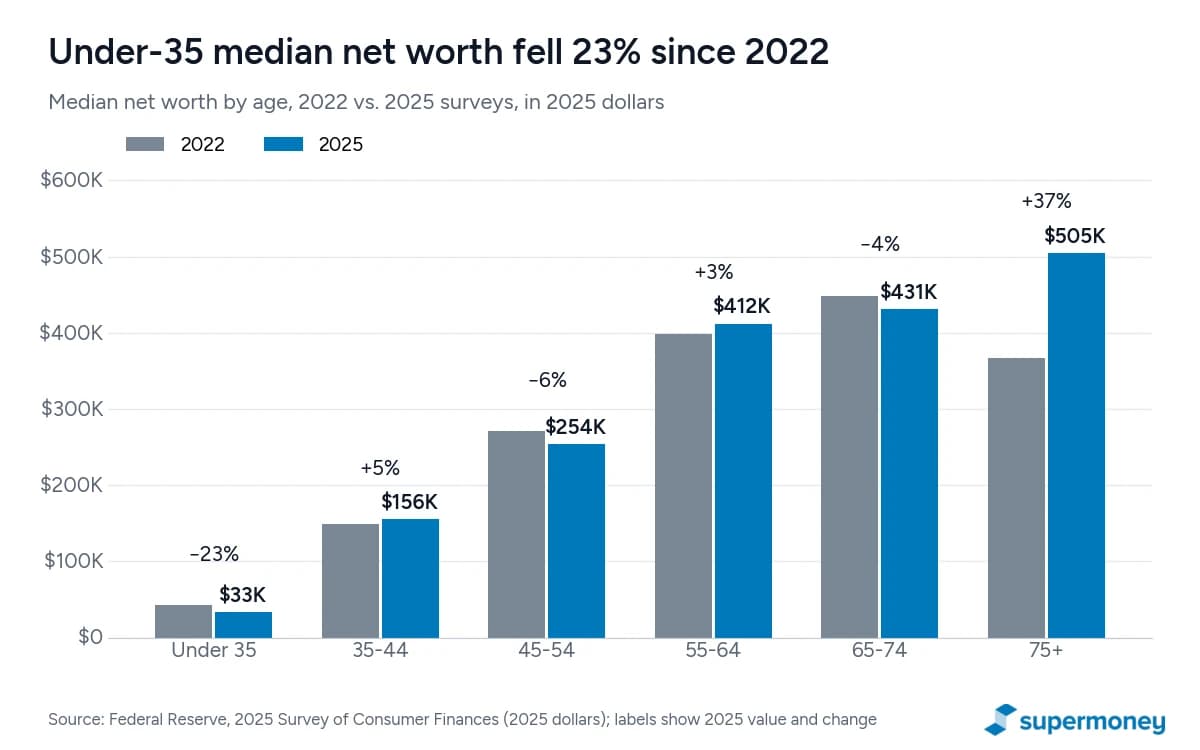
Across all households, the median rose 2% to $215,900 and the average rose 7% to $1.24 million. When the average grows faster than the median, the gains are going disproportionately to the top.
What it takes to be in the top 10% and top 1%
You need $351,000 to crack the top 10% under 35. By 45-54 the bar is $2.58 million, and for households 75 and older it’s $4.14 million.

Across all ages, the top 10% starts at about $2.55 million and the top 1% at about $16.5 million. Being a millionaire isn’t as rare as it sounds: about 1 in 5 U.S. households (21.5%) has a net worth of $1 million or more, counting home equity and retirement accounts. For a deeper look at the thresholds, see what it takes to be considered rich in the U.S.
What separates the middle from the top
Owning a home. The median homeowner has a net worth of $458,900. The median renter has $10,600.1 Under 35, only about 36% of households own, and those owners have a median net worth near $180,000, while renters the same age sit around $12,000. A house isn’t magic, but a mortgage is a forced savings plan: every payment moves a little money from the bank’s column to yours.
Income, and what you do with it. Median household income peaks at about $108,700 for ages 45-54, according to our analysis of the survey. For context, $50 an hour works out to about $104,000 a year full time, and $25 an hour is about $52,000. Our hourly to salary chart converts any wage from $7.25 to $100 an hour. Income makes building wealth easier, but plenty of high earners have little to show for it. The gap is the share of each paycheck that gets saved or invested.
Time in the market. Retirement accounts drove the biggest gains in this survey (see the average 401(k) balance by age for how those accounts stack up). Investing $500 a month at a 7% average annual return grows to about $86,500 in 10 years, and you only put in $60,000 of it. Keep it going to 65 and starting at 30 instead of 40 is worth about $900,000 versus $405,000, nearly half a million dollars from 10 extra years.
How to move up a percentile
- Know your number. Add up your accounts and debts once, then update it monthly. You can’t steer what you don’t measure.
- Kill high-interest debt first. Paying off a credit card at 24% APR is a guaranteed 24% return. No investment reliably beats that.
- Keep a cash cushion. An emergency fund stops one car repair from becoming new debt. Park it in a high-yield savings account so it earns something.
- Grab every dollar of employer match. A 50% match on 6% of a $70,000 salary is $2,100 a year of free money. Not sure you’re saving enough? Here’s how much you should have in your 401(k) at 30, 40 and 50.
- Catch up if you’re behind. If you’re past 50 and below the median, it isn’t too late. Here are 10 ways to catch up on retirement savings after 50.
Frequently asked questions
What is a good net worth for my age?
A good first benchmark is the median for your age group: $33,000 under 35, $155,600 at 35-44, $253,700 at 45-54, $411,900 at 55-64, $431,300 at 65-74 and $504,900 at 75 and older. Reaching the 75th percentile ($147,000 under 35, $470,000 at 35-44, $940,000 at 45-54) puts you ahead of three out of four households your age.
What is the average net worth of a 30-year-old?
For households headed by someone 30 to 34, the median net worth is about $63,800 and the average is about $201,400, based on our analysis of the Fed’s 2025 survey. For the whole under-35 group, the median is $33,000 and the average is $135,400.
What is the median net worth in the U.S.?
$215,900 per household in 2025, up 2% from 2022 after inflation. The average is $1,241,500.
What net worth puts you in the top 1%?
About $16.5 million across all ages. By age, the 99th percentile ranges from about $1.6 million under 35 to about $20.5 million at 55-74. The Fed’s survey excludes the Forbes 400, so the true top is even higher.
How many Americans have a negative net worth?
About 8% of households owe more than they own. It’s most common under 35, at roughly 17%, usually because of student loans and car loans with little savings to offset them.
Does net worth include home equity and retirement accounts?
Yes. The Fed counts home equity, 401(k)s, IRAs, cash, investments, vehicles and business equity, minus all debts. It does not count Social Security or traditional pensions, because those are future income streams without a cash value you can access today.
Why use households instead of individuals?
The Fed surveys families, so a married couple’s net worth counts once, not twice. If you’re married, compare your combined net worth to the table. If you’re single, your household is just you.
How often is this data updated?
Every three years. The 2025 survey, based on 4,367 interviews, was released in October 2026. The next one will cover 2028.
Ready to grow your number? SuperMoney shows your real net worth across every account in one place and gives you personalized tips to raise it, month after month.

Get the app: App Store | Google Play
Share this post:
Add as a preferred source on Google
Table of Contents